Text set in serif type with a dotted bar in the margin was drafted by an LLM (claude-opus-5) and sometimes reviewed by the author. The rest is the author's own. How to read this site
bimodality_grid_v1
20260427_223648_bimodality_grid_v1 · complete · published 2026-08-28 · seed 1000
part of investigation bimodality
Intent
Run 2026-04-27, 400 models at 1200 iterations each. Backfilled into the standardized results object on 2026-08-27 from the original run directory; the accuracies were re-read from the per-condition evaluation files and checked against the runner's own log, and no cell disagreed.
This experiment asks whether models trained at one α and differing only in seed concentrate around a single accuracy or fall into separate groups, and it asks the question across the whole useful range of α rather than near any particular value. Eight grid points run from 0.5 to 2.5, fifty replicates each, with the same fifty seeds at every point. The spacing is deliberately coarse: the purpose is to find out whether a split exists anywhere and roughly where, not to locate its edge.
Background
A five-seed pilot at α = 1.4 had shown replicates landing close together, which said that at least one point on the α axis is well behaved but left the rest of the range untouched. Fifty replicates per grid point is the smallest cohort that makes a two-group reading distinguishable from a wide one-group reading, so this is the first run large enough to tell the two apart.
Hypothesis
At low α no replicate should reach the subject-verb number rule within the budget, and at high α most should, so both ends of the grid should give tight cohorts. The prediction is that somewhere between them the cohort spread grows large enough that the replicates are better described as two groups than as one, and that mean unseen_mismatch rises across that region.
Setup
data regime (all arms): single-dataset-recycled — 1 dataset(s) × 1200 iters each = 4.0 epochs per dataset
Replicate this experiment
Get the code at this exact version:
git clone https://github.com/ClaireHobbs/imagining-syntax
cd imagining-syntax
git checkout d99f2d5
pip install -e ".[dev]"
Download the config (experiment.yaml) and run:
imsyn exp run experiment.yamlChecks
PASS children_complete PASS replicate_coverage PASS instrument_consistent
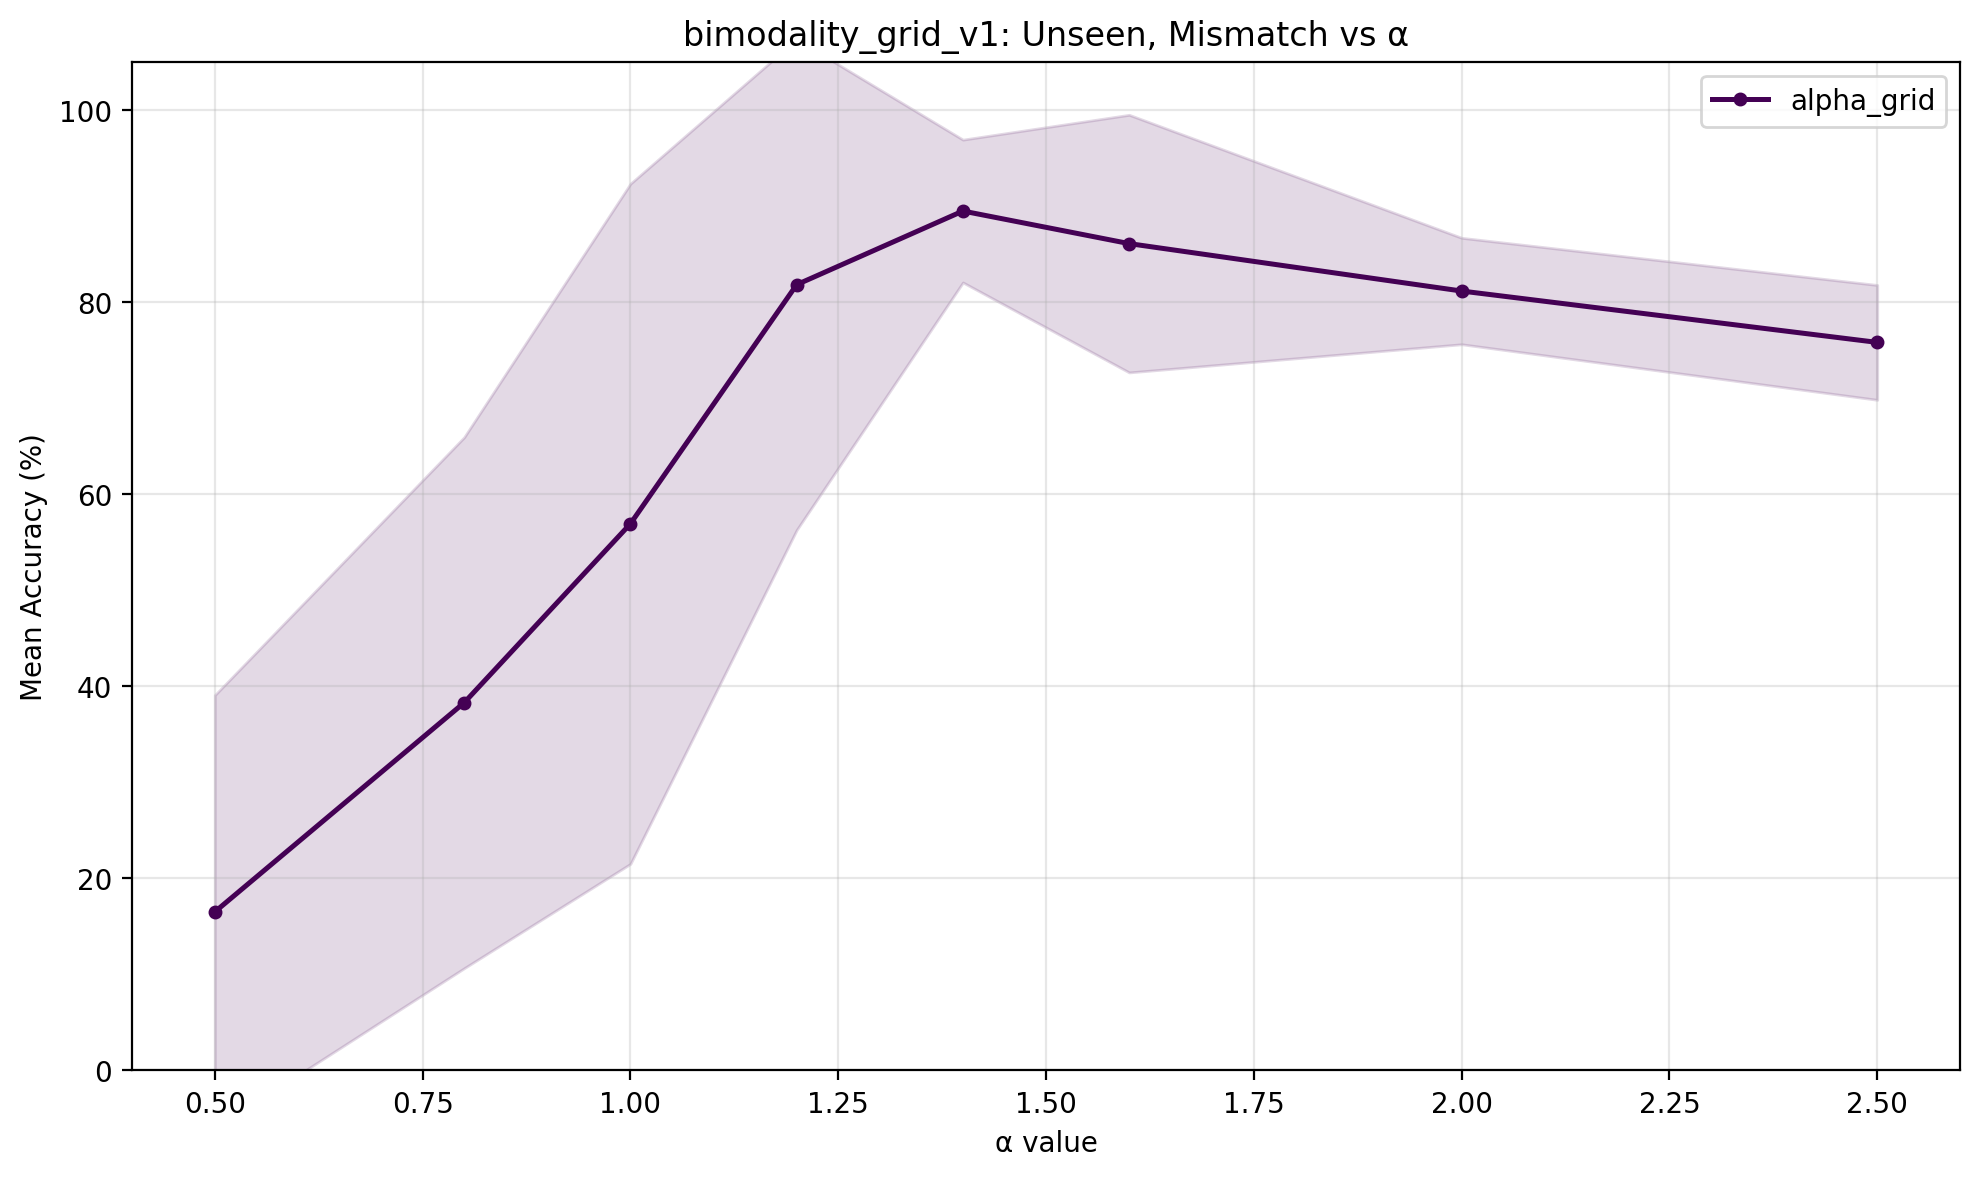
Results — unseen_mismatch (mean ± sd over 50 seeds)
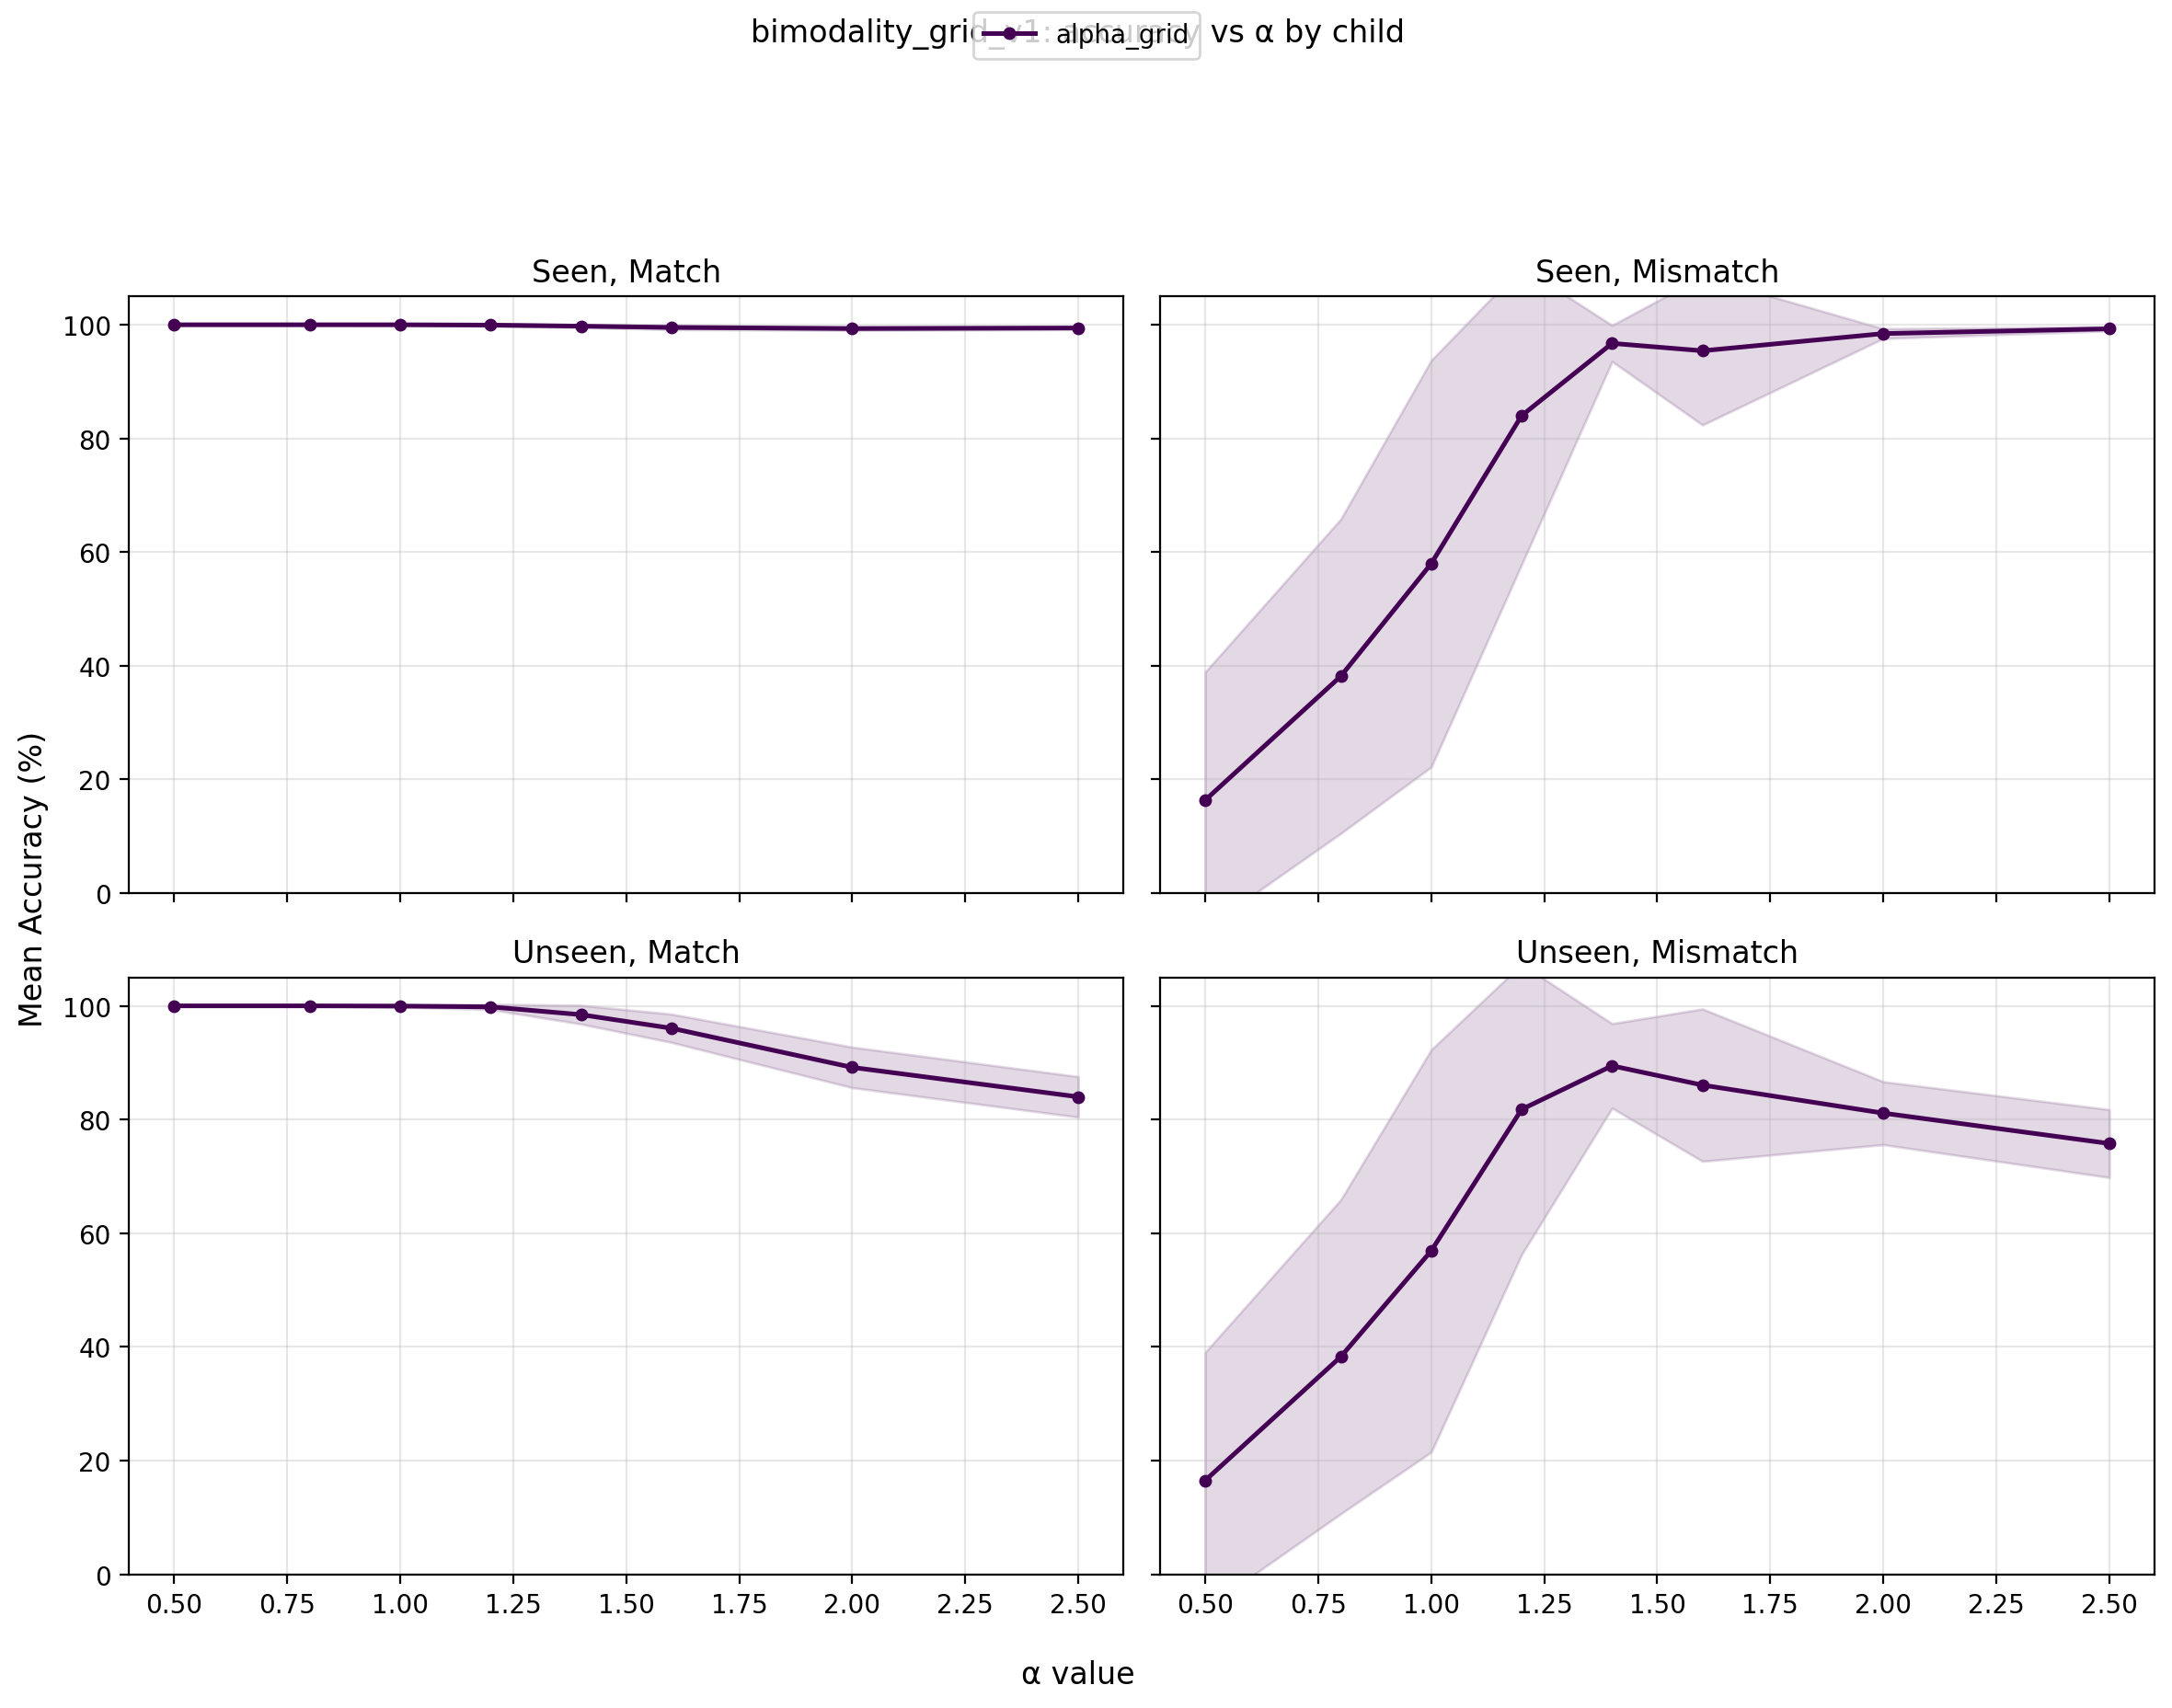
Evaluation data: seen_* generated at each grid point's own training α · unseen_* = held-out pairings, uniform (α-independent) · 1000 pairs per condition
- Each probe is a minimal pair: a grammatical sentence and its verb-number-flipped twin. The model scores correct when it assigns the grammatical version higher probability; accuracy = % correct over 1000 pairs per condition.
- seen_match / seen_mismatch — noun–verb pairings that occur in training, sampled at the same α the model was trained on (matched per grid point, so this eval data varies with the training α)
- unseen_match / unseen_mismatch — held-out noun–verb pairings that never occur in training, sampled uniformly (α = 0), so their difficulty is identical across all arms and training αs
- match vs mismatch — whether the prepositional objects agree in number with the subject; mismatch places attractor nouns between subject and verb (the AGREE-RECENT trap)
| arm | peak over α (end of training) | per-seed | flags |
|---|---|---|---|
| alpha_grid | 89.5 ±7.4 @ α=1.4 |
Conclusions
The grid found what it was built to find. Across the lower half of the axis the fifty replicates at each α do not concentrate, and above it they do, so the cohort spread is a property of where on the α axis a run sits rather than a constant feature of the sweep.
Between α = 0.5 and 1.2 the standard deviation of unseen_mismatch across seeds runs from 22.6 to 35.4, with replicates at both 0.0 and 100.0 at three of those four grid points. From α = 1.4 upward it falls to 7.4, 13.4, 5.5 and 6.0, and at α = 1.4, 2.0 and 2.5 every one of the fifty replicates scores above 50. Mean accuracy rises from 16.5 at α = 0.5 to a peak of 89.5 at α = 1.4 and then declines to 75.8 at α = 2.5, so the tightest cohorts sit past the peak rather than at it.
Referenced by (1 direct, 4 transitive)
Direct references:
This run predates the change that made the training pipeline deterministic across runners. Evaluation consumed the global random state that model construction and batching also draw on, so the weights at a given α and seed depended on which runner produced them, and no grid point here can be reproduced exactly. The reworked grid re-measured three of these grid points and agreed closely on the cohort means, differing by 3.0 at α = 0.8, 3.5 at α = 1.0 and 0.9 at α = 1.2, which says the coarse picture survived the pipeline change. Anything finer than a cohort mean should be taken from the reworked grid rather than from here. What this run still supplies is the upper half of the axis: α = 1.4 through 2.5 has never been re-run on the current pipeline, and the narrowing of the cohort there is the only evidence the corpus has that the spread closes at all.
Comparison figures
Children
| Child | peak unseen_mismatch | Status |
|---|---|---|
| alpha_grid | 89.5 | done |