Text set in serif type with a dotted bar in the margin was drafted by an LLM (claude-opus-4-8) and sometimes reviewed by the author. The rest is the author's own. How to read this site
anchor_v1
20260713_144937_anchor_v1 · complete · published 2026-07-16 · seed 42
Intent
This is Phase 1 of the φ-landscape study, whose design and full term definitions live in the design spec.
Its purpose is to pin down how high the generalization score of the current best training schedule actually peaks, and to reconcile the two ways of delivering that schedule's data, staged and continuous. Both run at a high seed count, forty seeds per arm, so that any run-to-run split in outcomes shows up as itself rather than being averaged away.
Background
The best-known schedule, peak_30, is a descending staircase whose high-concentration teeth alternate with drops to a moderate floor, trained on freshly generated per-stage data.
Hypothesis
The best-known schedule, trained on staged data, is expected to reach about 98 on the generalization score. Its continuous-data twin, in which every batch is sampled fresh, is expected to reach about 96, a gap of roughly two points between the two settings. The sub-100 average is expected to come from a minority of runs that fail to solve the rule, a split into two clusters across random seeds rather than uniform scatter. A single fixed concentration, α = 1.6, is expected to peak around 95 to 96.
Curricula
All three arms run the same 900-iteration budget at forty
replicates each and are scored against the same fixed
evaluation suite, so the only things that vary are the training
schedule and how its data is delivered. Higher α concentrates
training on a few frequent noun-verb pairings; lower α spreads them out.
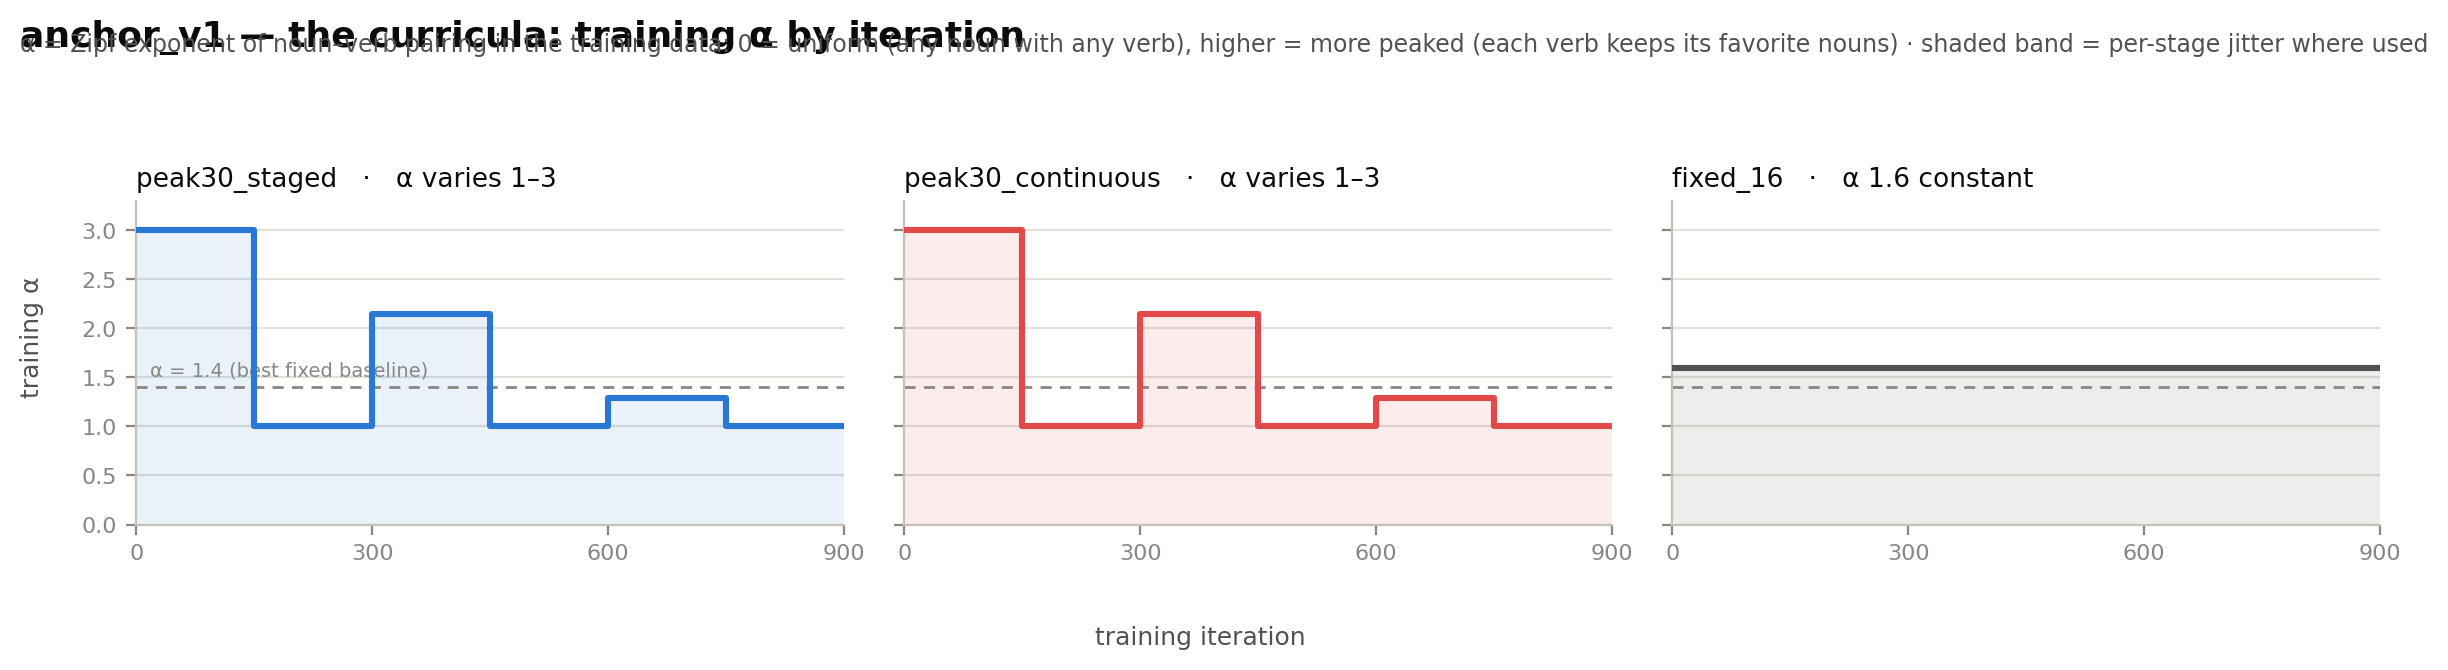
Each arm's α over training is drawn in images/schedules.png, and
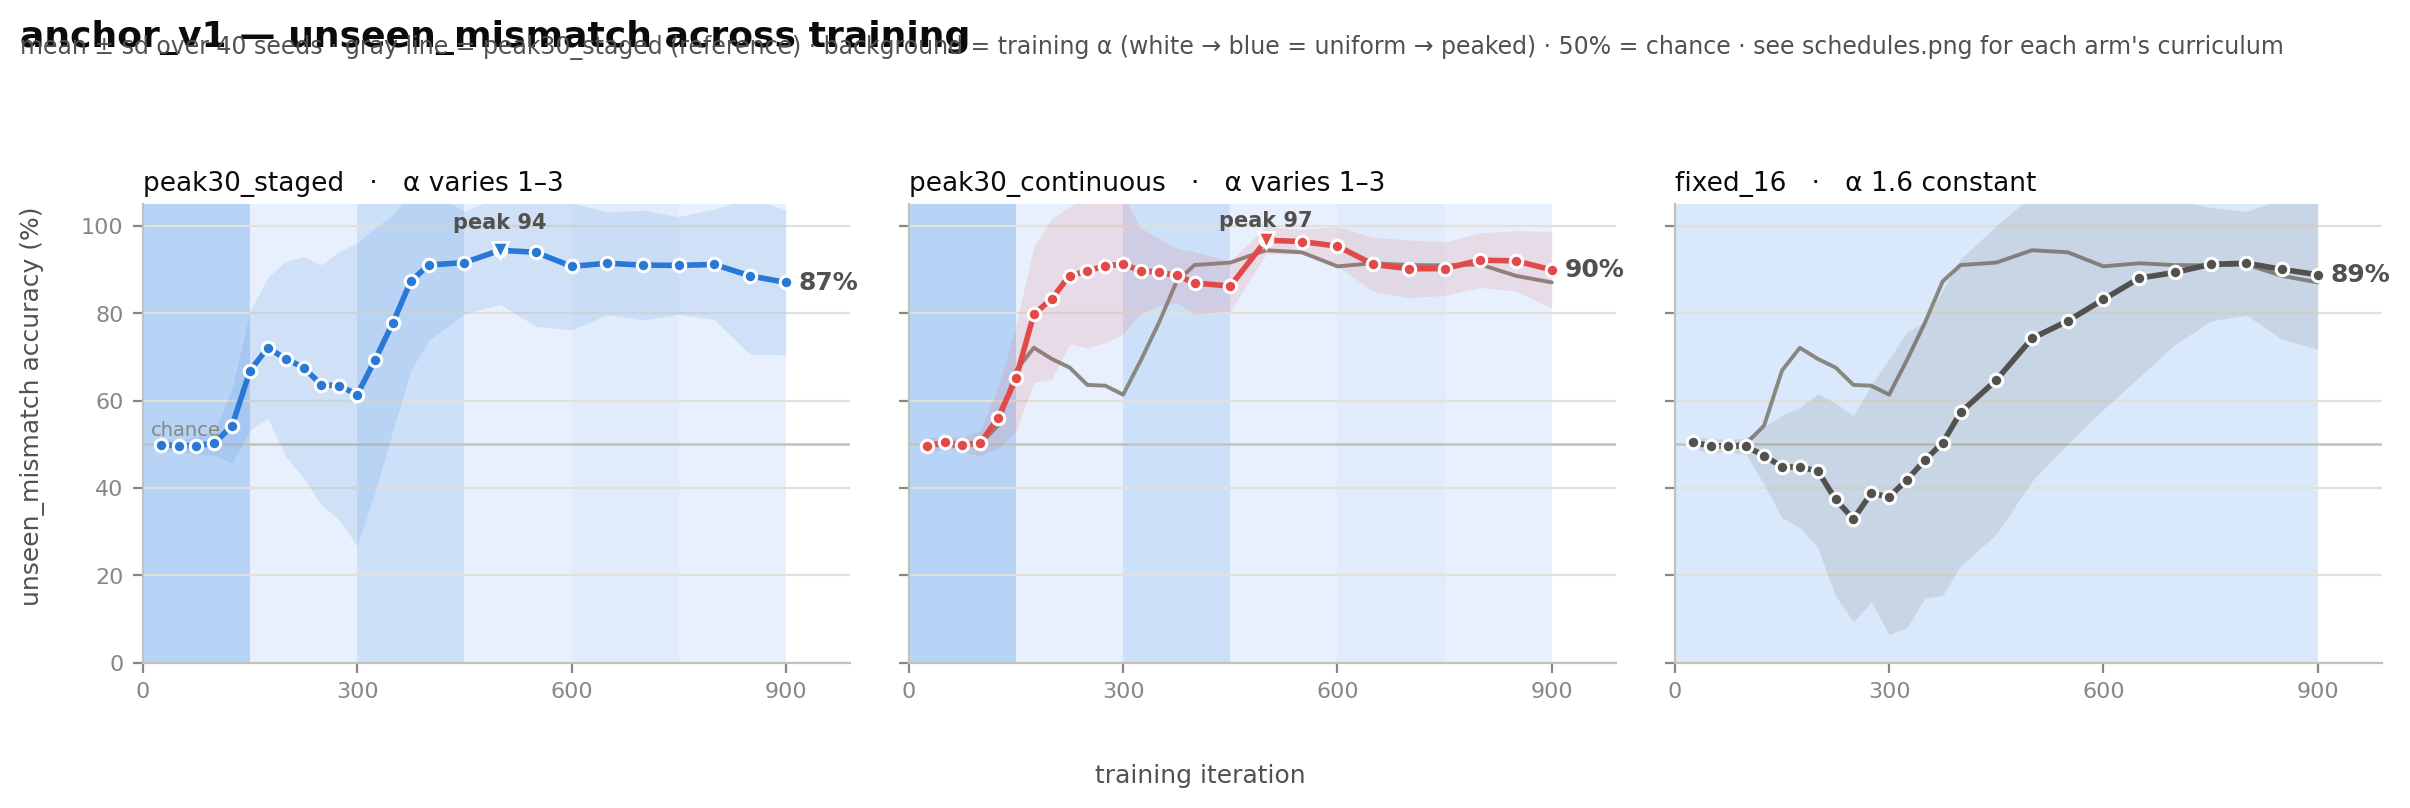
their generalization trajectories are overlaid in
images/curriculum_comparison.png.
- peak30_staged is the current best schedule, peak_30: a descending three-tooth burst schedule ladder that steps α down through 3.0, 1.0, 2.14, 1.0, 1.29, 1.0 across six 150-iteration segments. It trains on staged data, meaning a fresh finite dataset is generated once per segment and reused within it.
- peak30_continuous runs the identical α-schedule on continuous data, a data regime in which every training batch is sampled fresh at the current α, so no sentence is ever seen twice. The schedule matches
peak30_stagedexactly; only the data delivery differs. - fixed_16 is the control: the single best fixed concentration, α = 1.6, held for the whole run on staged data.
Setup
| arm | data regime | datasets | iters/dataset | epochs/dataset |
|---|---|---|---|---|
| fixed_16 | single-dataset-recycled | 1 | 900 | 3.0 |
| peak30_continuous | with-replacement (legacy stream) | ∞ | — | 0.0 |
| peak30_staged | fresh-dataset-per-stage | 6 | 150 | 0.5 |
Replicate this experiment
Get the code at this exact version:
git clone https://github.com/ClaireHobbs/imagining-syntax
cd imagining-syntax
git checkout 2ba5de382136
pip install -e ".[dev]"
Download the config (experiment.yaml) and run:
imsyn exp run experiment.yamlChecks
PASS children_complete PASS replicate_coverage PASS schedule_total_matches_final_waypoint PASS instrument_consistent
Claims
| claim | source | expectation | Δ | seeds | verdict |
|---|---|---|---|---|---|
| peak30_reaches_high_90s | manifest | peak30_staged >= 96 on unseen_mismatch @ peak | -1.6 | 30/40 | mixed mean says rejected, seeds 30/40 |
| staged_at_least_continuous | manifest | peak30_staged >= peak30_continuous on unseen_mismatch @ peak | -2.3 | 29/40 | mixed mean says rejected, seeds 29/40 |
| fixed16_peaks_mid_90s | manifest | fixed_16 >= 93 on unseen_mismatch @ peak | -1.5 | 27/40 | mixed mean says rejected, seeds 27/40 |
Results — unseen_mismatch (mean ± sd over 40 seeds)
Evaluation data: seen_* probed at reference α = 1.4 · unseen_* = held-out pairings, uniform (α-independent) · 1000 pairs per condition
- Each probe is a minimal pair: a grammatical sentence and its verb-number-flipped twin. The model scores correct when it assigns the grammatical version higher probability; accuracy = % correct over 1000 pairs per condition.
- seen_match / seen_mismatch — noun–verb pairings that occur in training, sampled at fixed reference α = 1.4 (not at the schedule's own α, so arms stay comparable)
- @α conditions (e.g. seen_match@0) — the same seen probes regenerated at reference α = 0, 0.7, 2.1, 3
- unseen_match / unseen_mismatch — held-out noun–verb pairings that never occur in training, sampled uniformly (α = 0), so their difficulty is identical across all arms and training αs
- match vs mismatch — whether the prepositional objects agree in number with the subject; mismatch places attractor nouns between subject and verb (the AGREE-RECENT trap)
| arm | end of training (t = 900) | per-seed | flags |
|---|---|---|---|
| fixed_16 | 88.8 ±17.1 | ⚠ seed_split: range 0.0-100.0 (1 low / 25 high of 40) | |
| peak30_continuous | 90.0 ±8.8 | ⚠ seed_split: range 55.5-100.0 (1 low / 26 high of 40) | |
| peak30_staged | 87.1 ±16.6 | ⚠ seed_split: range 26.0-100.0 (1 low / 25 high of 40) |
Conclusions
Read one seed at a time, the peak-height question is already settled.
Taking each replicate's own best point in training, unseen_mismatch reaches a median of 100.0 for peak30_staged, 99.8 for peak30_continuous, and 100.0 for fixed_16, with means of 99.1, 99.3, and 97.5. Between 37 and 39 of the 40 seeds in each arm peak at 95 or above. By this per-seed reading the generalization score is saturated near 100, and the hypothesis's estimate of about 98 for the staged schedule is low. There is little height left to gain.
Referenced by (1 direct, 1 transitive)
Direct references:
Transitive (depth 1):
The familiar sub-98 ceilings come from summarizing the same cohort the other
way. The peak of the mean curve, the average across seeds at whichever
single waypoint that average is highest, is 94.4 for peak30_staged,
96.7 for peak30_continuous, and 91.5 for fixed_16. That
number sits below what the seeds individually reach for two reasons the mean
folds together: seeds peak at different training times, so no single
waypoint catches them all at their best, and a small group of failing seeds
pulls the average down. The per-seed peak is the honest measure of how high
a schedule goes, and by it the ceiling is essentially 100.
What separates the arms is not the height a good seed reaches but how many
seeds reach it. The middle of each cohort is tight, with an interquartile
range of per-seed peaks of 0.0 for staged and 0.6 for
continuous, so most
seeds land on the ceiling together. The spread lives in the tail, where one
to three of the 40 seeds fail to reach the 95 band. Continuous data
produces the tightest cohort, with a per-seed-peak standard deviation of
1.4, against 4.8 for staged and 8.4 for fixed_16. This is a small
failing minority, not the broad two-cluster split the
hypothesis imagined.
The two data settings reach the same peak, and continuous reaches it sooner.
Per seed both settle near 100, so the roughly two-point staged-over-continuous
gap the hypothesis predicted does not appear; at the peak of the mean curve
the ordering is reversed, with continuous at 96.7 above staged at 94.4.
Where they differ is speed. Averaged over the seeds that reached the band,
continuous crosses the 95 line at about 236 iterations, staged at about 330,
and fixed_16 at about 511, computed over 39, 39, and 37 of the 40
seeds respectively. Continuous is both the tightest and the fastest of the
three, which reverses the earlier reading
that staged near 98 beat
continuous near 96.
Referenced by (1 direct)
Direct references:
All three pre-registered claims come back mixed, and for one shared reason.
Each was written against the cohort mean at the peak waypoint, which the
failing minority drags below the threshold even though most seeds
individually clear it. The claim peak30_reaches_high_90s asked
whether peak30_staged reaches 96 on unseen_mismatch at
its peak: the mean is 94.4 against the threshold of 96, short by 1.6, while
30 of 40 seeds meet it individually. The claim
staged_at_least_continuous asked whether staged is at least as
high as continuous at the peak: the mean puts staged at 94.4 below
continuous at 96.7, a gap of 2.3, with 29 of 40 seeds meeting the bound. The
claim fixed16_peaks_mid_90s asked whether fixed_16
reaches 93: its mean is 91.5 against 93, short by 1.5, with 27 of 40 seeds
meeting it. The verdicts reflect the summary the claims were written on, not
a failure of the schedules. The lesson carried forward is to write claims on
per-seed summaries, the median and the fraction of seeds past a threshold,
rather than on the mean.
For the rest of the campaign this closes the first objective and sharpens the other two. Absolute peak height is answered: it is saturated near 100 and reached by roughly 95 percent of seeds, so Phases 2 through 5 have no height left to chase. What stays live is speed, the time it takes to reach the band, and the failing-seed minority, the consistency question. Those are the axes the later phases are scored on.
Referenced by (2 direct, 4 transitive)
Direct references:
One caution from code review carries into every later phase. The time-to-band figure averages only the seeds that actually reached the band, so it has to be read next to the seed coverage figure, the fraction of seeds peaking at 95 or above. A fast crossing computed over a handful of survivors is not a win.
Comparison figures
Children
| Child | peak unseen_mismatch | Status |
|---|---|---|
| peak30_staged | 94.4 | done |
| peak30_continuous | 96.7 | done |
| fixed_16 | 91.5 | done |