Text set in serif type with a dotted bar in the margin was drafted by an LLM and sometimes reviewed by the author. The rest is the author's own. How to read this site
peaksweep_v1
20260712_190403_peaksweep_v1 · complete · published 2026-07-16 · seed 42
Intent
This experiment asks whether 3.0 is the right height to start the descending α ladder of efficiency_v1's winning schedule from. It holds the winning schedule's structure fixed, keeping the same stage length, the same seeds, and the same 900-iteration prefix, and sweeps only the ladder's starting peak P from 1.0 to 5.0, scaling the three rungs together as P, 0.714P, and 0.429P. The P = 3.0 arm is byte-identical training to efficiency_v1's winner over these 900 iterations, so what is new is the P axis and a finer waypoint spacing, every 50 iterations instead of 150, to resolve when the generalization peak actually arrives.
Background
The α-schedule line that produced efficiency_v1's winning curriculum settled on a descending ladder of concentration values that starts at α = 3.0 and alternates with drops to α = 1.0 across six 150-iteration stages.
efficiency_v1's 150-iteration waypoint grid could not distinguish a true peak arriving before iteration 600 from one at 450.
Hypothesis
The first prediction is that the strength of the peaked-first effect rises with P and then flattens. At P of 1.5 or below the ladder loses the peaked-first advantage and its onset should look like a fixed α = 1.4 run; P = 2 should be a partial case; and P across 3 to 5 should behave alike. The test of saturation is whether peak_40 or peak_50, the arms at P = 4 and P = 5, beats peak_30, the P = 3 arm, on peak height or on time-to-90%: if either does, α = 3 was under-saturated and the next sweep should start higher. The second prediction is that the finer waypoint grid will place the true peak before iteration 600, and that the trajectory will jump during the second ladder stage, between iterations 300 and 450, once the first α = 1.0 burst has consolidated the collocations built at α = P.
Curricula
Every arm shares the structure of efficiency_v1's winning curriculum and changes only its height. The schedule runs for 900 iterations in six 150-iteration segments, and each segment draws a fresh 12,000-sentence dataset at its own concentration α. Higher α makes each verb's subject more predictable in the training data, from α = 0, where nouns and verbs pair uniformly, up toward the near-deterministic pairings at α = 3 and above; α = 1.4 is the paper's best fixed setting.
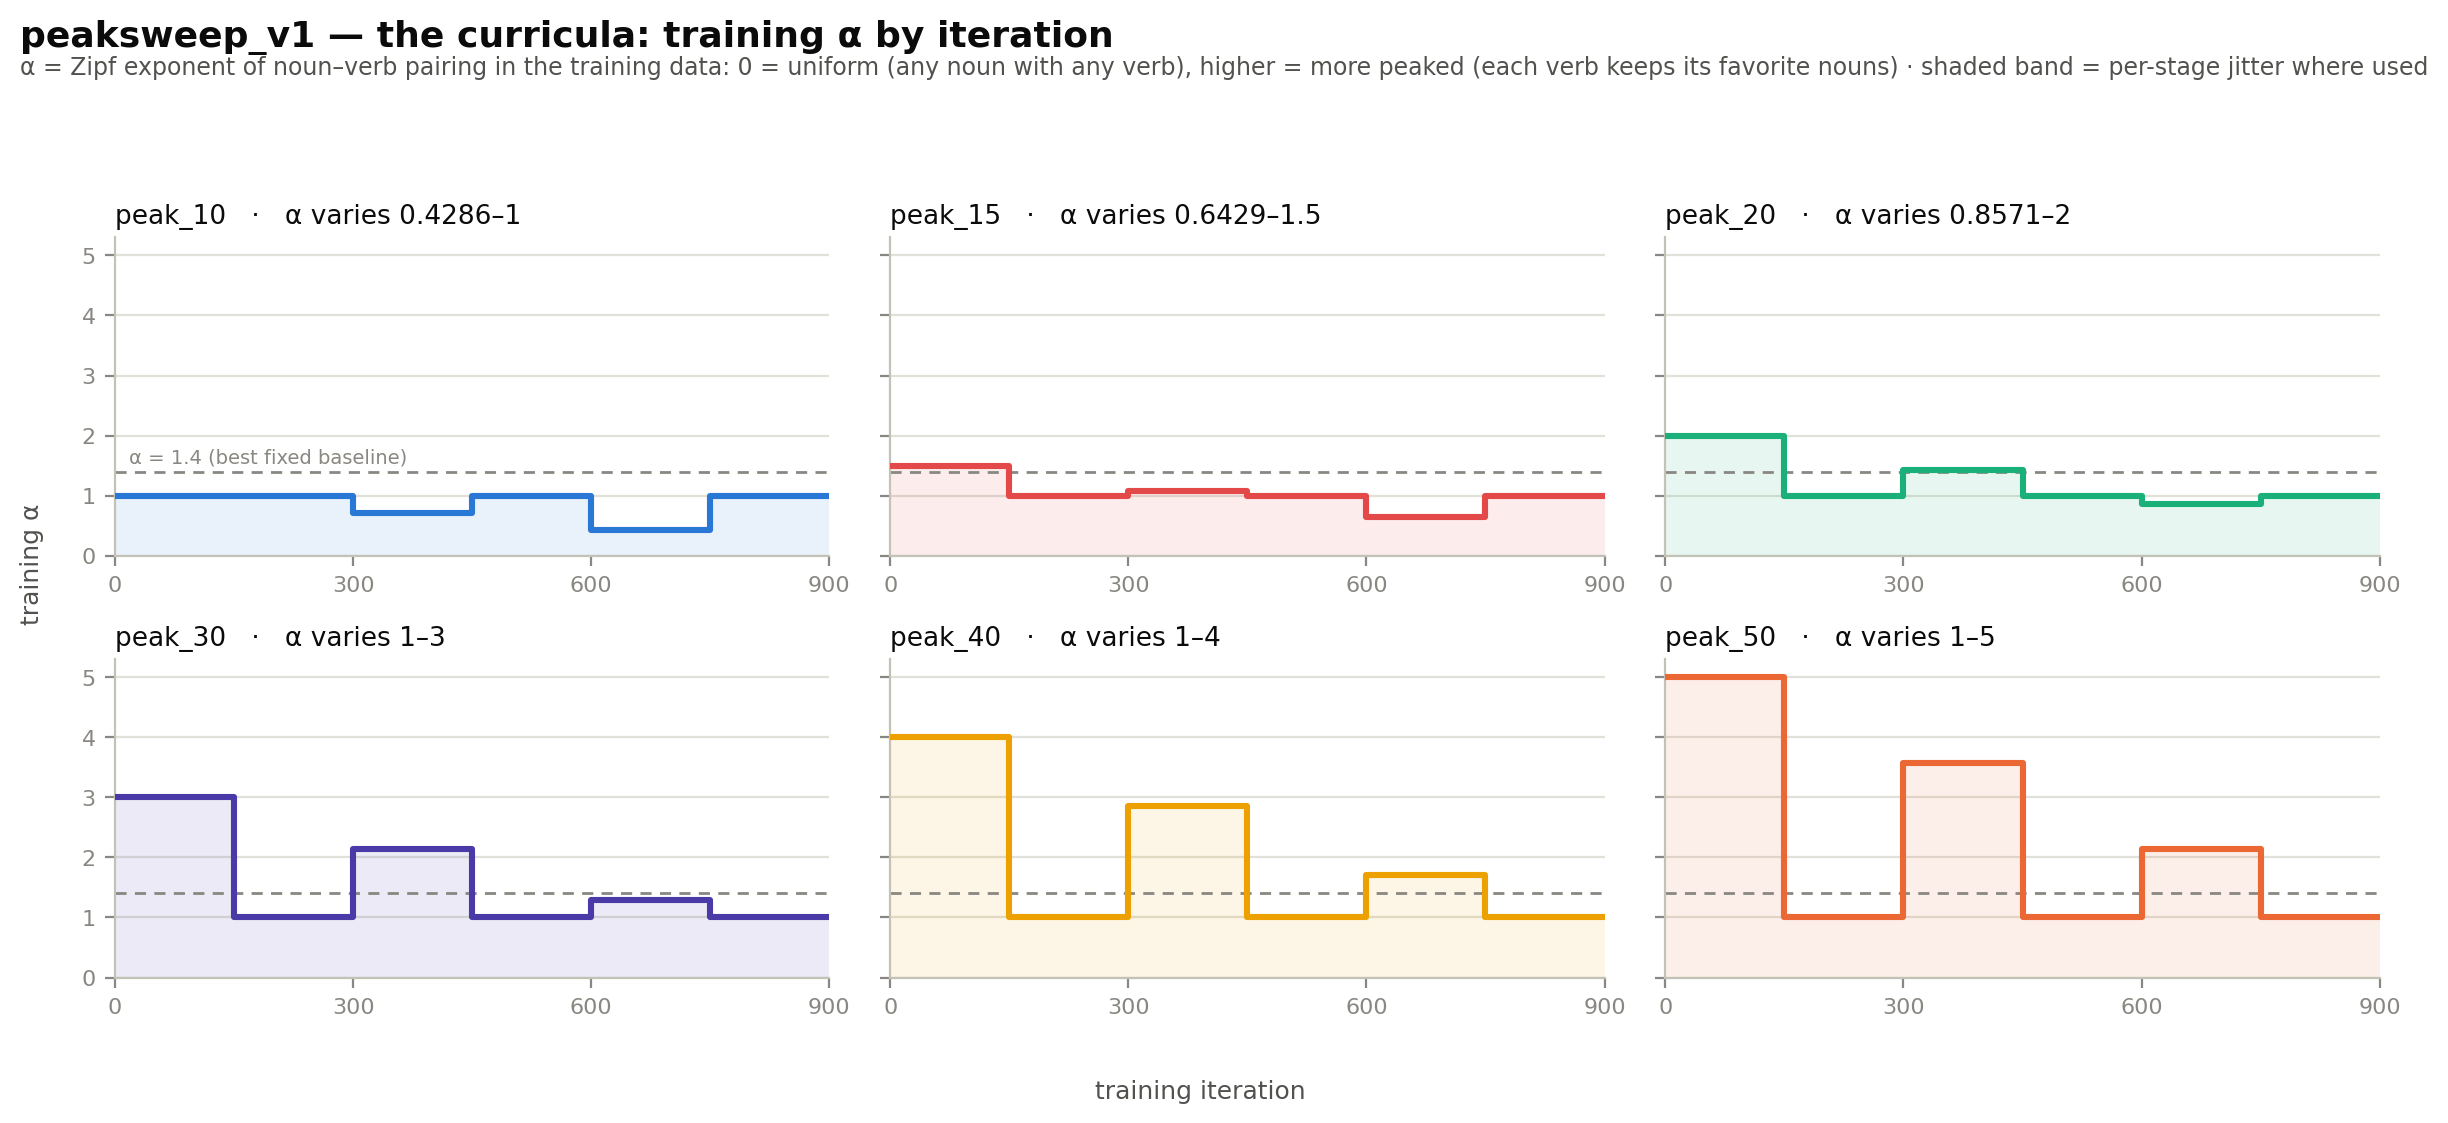
The six segments alternate a descending ladder of high-α teeth with drops to α = 1.0 between them. Stages 1, 3, and 5 carry the ladder, at P, 0.714P, and 0.429P, and stages 2, 4, and 6 sit at α = 1.0. Those drops to a low floor and recoveries are the bursts of the φ-landscape schedule family. What the sweep varies is the ladder's starting height P:
- peak_10, ladder 1.0, 0.71, 0.43. No peaked start, and the lower two rungs fall below α = 1.0.
- peak_15, ladder 1.5, 1.07, 0.64.
- peak_20, ladder 2.0, 1.43, 0.86.
- peak_30, ladder 3.0, 2.14, 1.29. This is efficiency_v1's winner, replicated.
- peak_40, ladder 4.0, 2.86, 1.71.
- peak_50, ladder 5.0, 3.57, 2.14.
Because the rungs scale together, every arm below about P = 2.33 sends its
lowest rung under α = 1.0, into the near-uniform range, while at P = 3 and
above every rung stays at or above 1.29. The gray reference line in
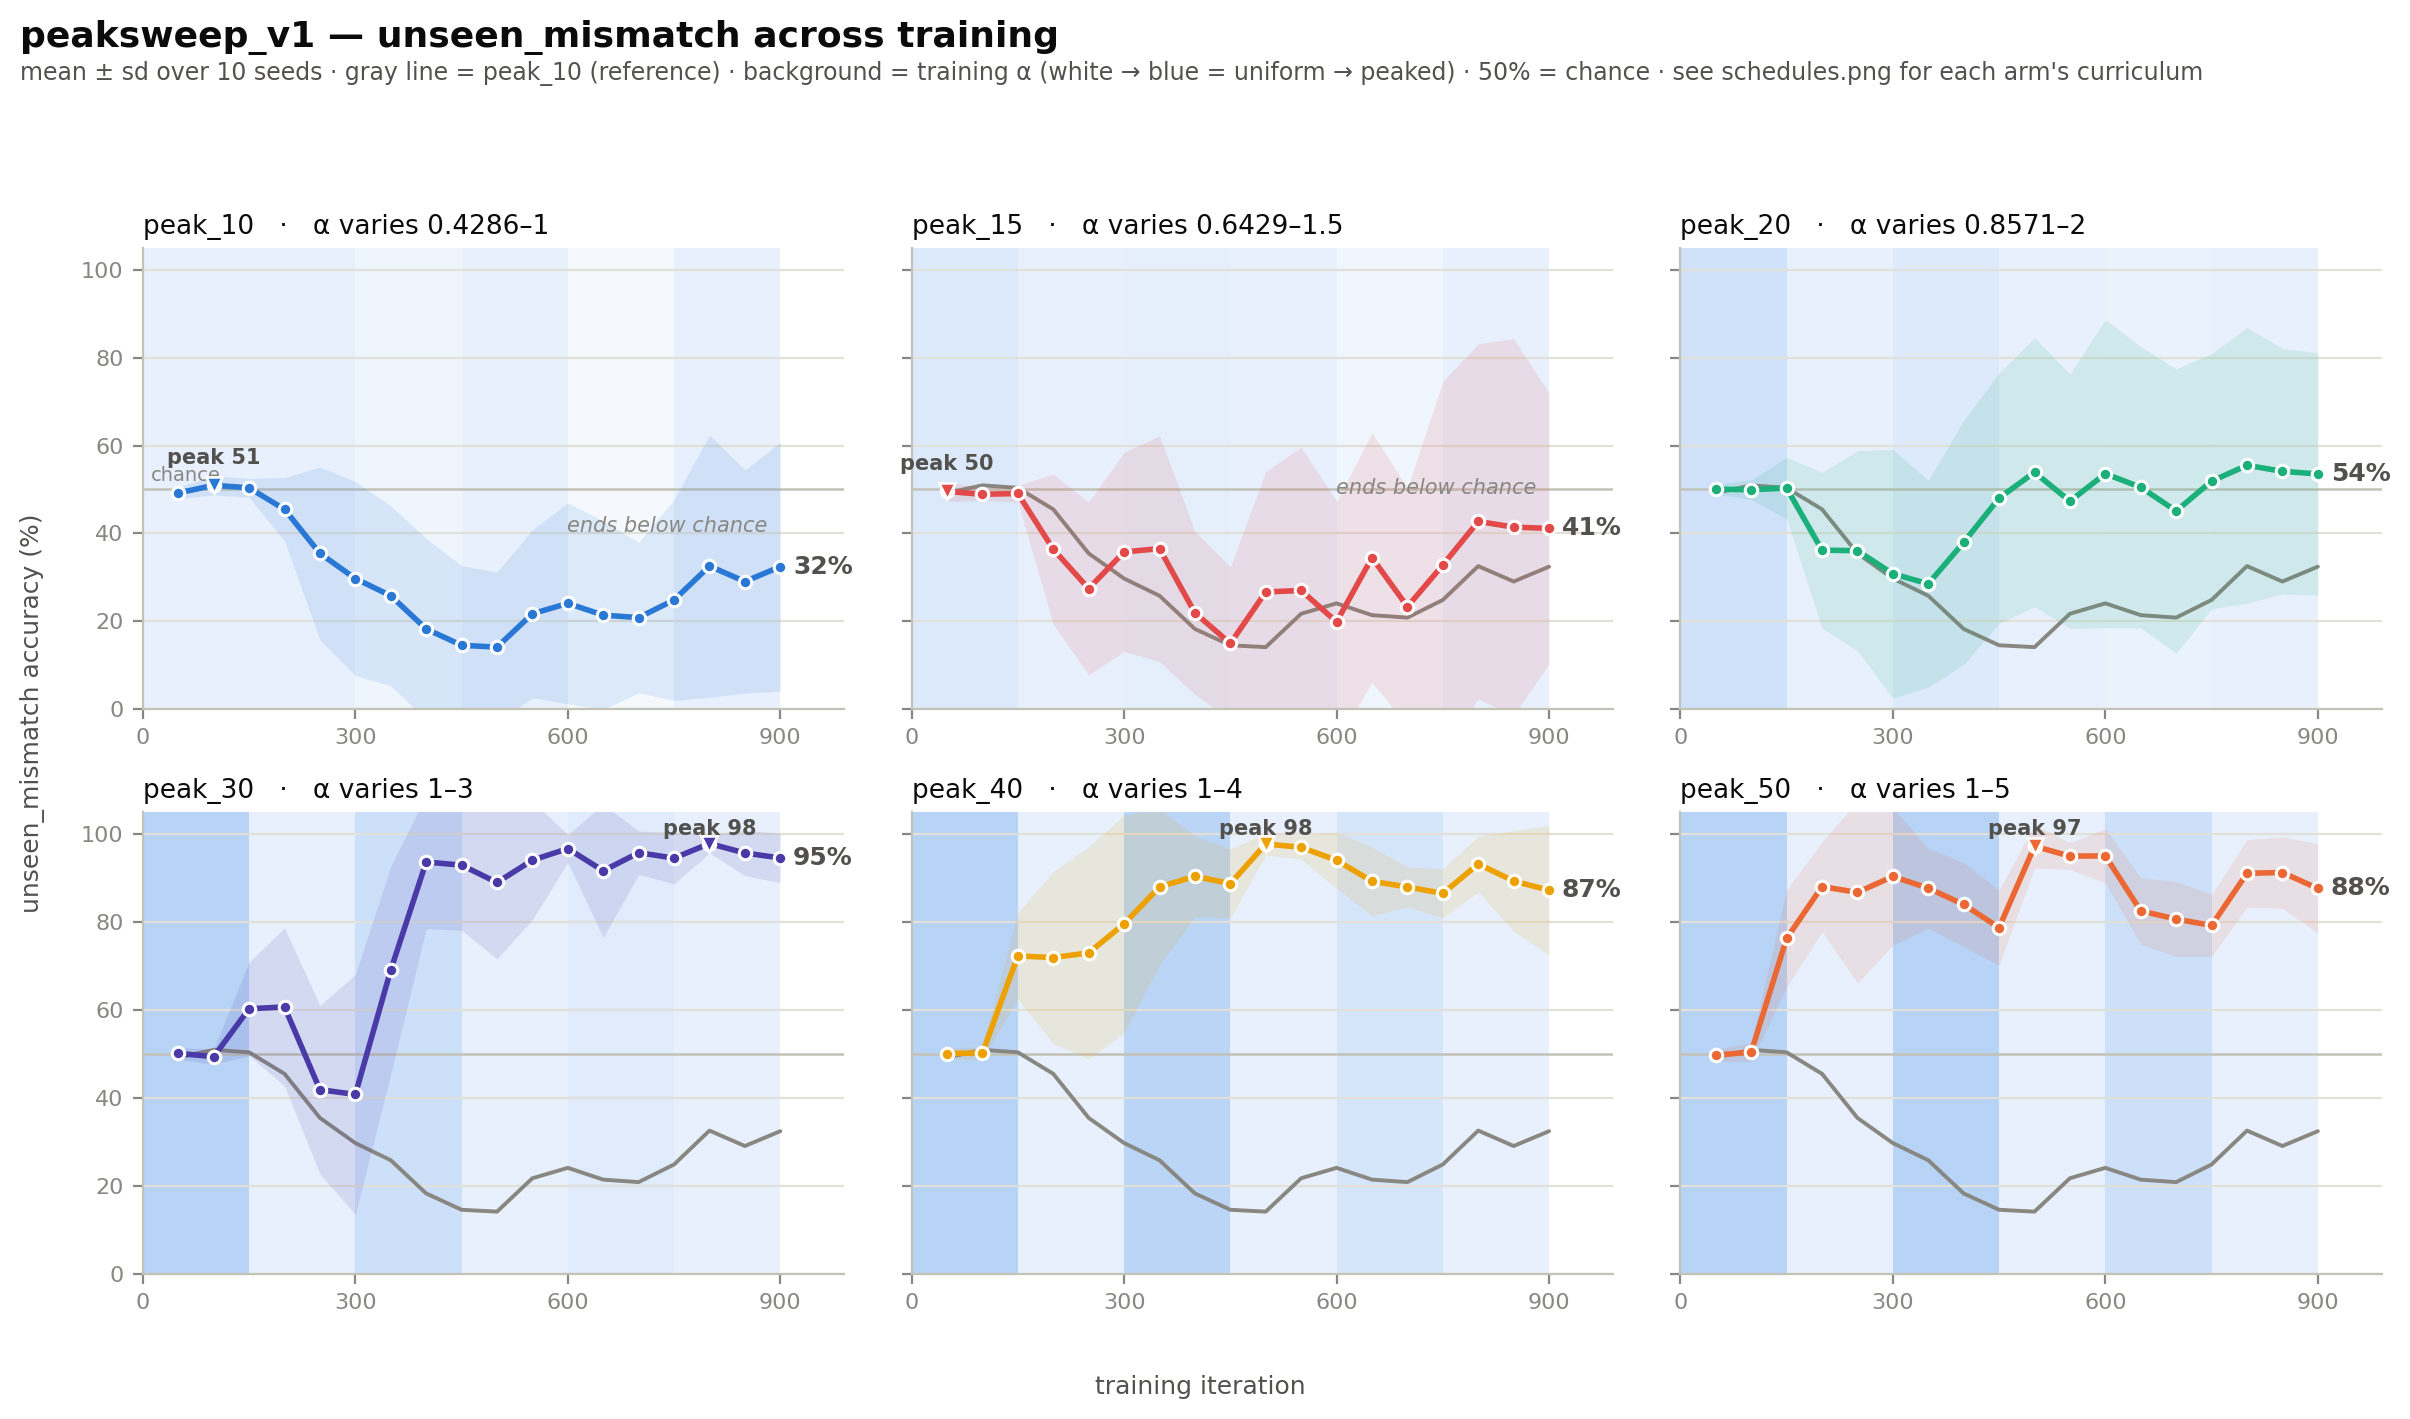
images/curriculum_comparison.png is the fixed α = 1.4 baseline
carried over from efficiency_v1; its waypoints are spaced every 150 iterations
and so appear coarser. Each arm's α over training is drawn in
images/schedules.png.
Setup
data regime (all arms): fresh-dataset-per-stage — 6 dataset(s) × 150 iters each = 0.5 epochs per dataset
Replicate this experiment
Get the code at this exact version:
git clone https://github.com/ClaireHobbs/imagining-syntax
cd imagining-syntax
git checkout d5b6d88ea162
pip install -e ".[dev]"
Download the config (experiment.yaml) and run:
imsyn exp run experiment.yamlChecks
PASS children_complete PASS replicate_coverage PASS schedule_total_matches_final_waypoint PASS instrument_consistent
Results — unseen_mismatch (mean ± sd over 10 seeds)
Evaluation data: seen_* probed at reference α = 1.4 · unseen_* = held-out pairings, uniform (α-independent) · 1000 pairs per condition
- Each probe is a minimal pair: a grammatical sentence and its verb-number-flipped twin. The model scores correct when it assigns the grammatical version higher probability; accuracy = % correct over 1000 pairs per condition.
- seen_match / seen_mismatch — noun–verb pairings that occur in training, sampled at fixed reference α = 1.4 (not at the schedule's own α, so arms stay comparable)
- @α conditions (e.g. seen_match@0) — the same seen probes regenerated at reference α = 0, 0.7, 2.1, 3
- unseen_match / unseen_mismatch — held-out noun–verb pairings that never occur in training, sampled uniformly (α = 0), so their difficulty is identical across all arms and training αs
- match vs mismatch — whether the prepositional objects agree in number with the subject; mismatch places attractor nouns between subject and verb (the AGREE-RECENT trap)
| arm | end of training (t = 900) | per-seed | flags |
|---|---|---|---|
| peak_10 | 32.4 ±28.3 | ⚠ seed_split: range 0.0-92.3 (3 low / 1 high of 10) | |
| peak_15 | 41.1 ±30.8 | ⚠ seed_split: range 0.0-88.8 (3 low / 2 high of 10) | |
| peak_20 | 53.5 ±27.6 | ⚠ seed_split: range 0.0-93.6 (1 low / 1 high of 10) | |
| peak_30 | 94.6 ±5.6 | ||
| peak_40 | 87.3 ±14.8 | ⚠ seed_split: range 47.6-99.7 (1 low / 6 high of 10) | |
| peak_50 | 87.7 ±10.2 |
Conclusions
Starting the ladder at α = 3.0 is the best of the six heights for the endpoint the curriculum is judged on.
At the end of training the P = 3.0 arm reaches mean 94.6 over ten replicates on unseen_mismatch, the held-out mismatch condition that is the project's main outcome, which is 8.6 points above the fixed α = 1.4 baseline's 86.0. Its ten seeds land between 83.6 and 100 with no failing minority, the tightest spread in the sweep. peak_40 and peak_50 finish lower and more scattered, at 87.3 and 87.7, and peak_40 leaves one seed at 47.6.
Raising P above 3 does not raise the peak. The best score reached at any waypoint, averaged over seeds, is 97.9 for peak_30, 97.8 for peak_40, and 97.3 for peak_50, and at the per-seed level every one of the thirty seeds across these three arms reaches at least 90 at some point in training. Peak height is saturated at P of 3 and above: the ceiling is already in hand at α = 3, so on the height reading of the hypothesis's test peak_40 and peak_50 do not exceed peak_30 and there is no reason to sweep P higher.
What extra peakedness buys instead is speed to that ceiling, and this is where the two halves of the hypothesis's test come apart. Read per seed and averaged over the seeds that arrive, the time to the 90 band falls from 380 iterations at P = 3 to 300 at P = 4 and 270 at P = 5, with all ten seeds of each arm reaching the band, so the coverage behind those times is full and the comparison is fair. By the height half of the test α = 3 is saturated, but by the time-to-90% half the steeper arms do arrive sooner, so which answer applies depends on the objective. It resolves at the endpoint: the steeper arms peak around iteration 500 and then drift down over the rest of training, ending near 87, while peak_30 reaches its near-peak band later and is still close to it at 900. For the winning-curriculum question, whose score is the endpoint, α = 3 is the right height; higher P is a speed lever with a consistency cost, the trade the later φ-landscape work takes up once height is known to be saturated.
Referenced by (4 direct, 2 transitive)
Direct references:
Below P = 3 the schedule stops working, and it stops sharply rather than gradually. peak_20, at P = 2, is bimodal: only four of its ten seeds ever reach the 90 band, the others stalling below it, so its seeds fall into a group that learns the rule and a group that does not, and the final mean of 53.5 averages across that split rather than describing a typical run. peak_15 and peak_10 finish at 41.1 and 32.4, below the fixed baseline. The turn-on between P = 2 and P = 3 is a phase transition, not a slope: the concentrated signal has to be strong enough to beat the attractor, and below that threshold the whole pattern fails.
The low-P collapse is a loss of the agreement rule, not merely a failure to generalize it. The same three arms fall the same way on seen_mismatch, the trained-pairing version of the attractor probe, finishing at 32.3, 40.9, and 54.1 there, with individual seeds below the 50 chance line, which means the model has settled on agreeing with the nearest noun rather than the subject (recency). Their easy conditions stay at the ceiling throughout, with seen_match and unseen_match both at 100, so the break is confined to the mismatch probes where an attractor sits between subject and verb. Two features move together in the low-P arms and this sweep does not separate them: the peak is too low to build a strong verb-to-subject cue, and the ladder's lowest rung drops below α = 1.0 into the near-uniform range that curriculum_v1 showed can erase an already-learned rule by interference. An unscaled-ladder control, holding the rungs at P and 1.0 with no sub-1.0 stage, would tell the two apart.
Referenced by (1 direct, 2 transitive)
Direct references:
The finer grid resolves when the peak arrives and confirms the predicted shape. For peak_30 the seed-mean trajectory reaches 60.3 by iteration 150 as the α = 3 stage builds the collocations, falls to 40.8 by iteration 300 as the first α = 1.0 burst passes, and then climbs to 93.7 by iteration 400 during the second ladder stage at α = 2.14. The rise to the near-peak band is complete by iteration 400, and every seed is above 90 by iteration 600, so the peak arrives well before the 600 the coarse grid could not rule out, and the climb lands in the second stage right after the first burst, both as the hypothesis predicted.
The burst is not a monotone help along the way; it trades a temporary dip for a firmer rule once the next tooth consolidates it.
The replication check holds, so the cross-experiment comparison rests on solid ground. peak_30 is training-identical to efficiency_v1's winning arm over these 900 iterations, and it reproduces that run at the shared points, finishing at 94.6 on unseen_mismatch with the same seeds and data.
Taken together, the sweep answers its question and hands the φ-landscape study its next one. α = 3.0 is the right place to start the ladder, the peak height is saturated from there upward, and the axis that still moves is speed against consistency, which is where the refinement work goes next.
Comparison figures
Children
| Child | peak unseen_mismatch | Status |
|---|---|---|
| fixed α 1.4 (efficiency_v1 fixed_14) | 90.5 | baseline |
| peak_10 | 50.9 | done |
| peak_15 | 49.6 | done |
| peak_20 | 55.5 | done |
| peak_30 | 97.9 | done |
| peak_40 | 97.8 | done |
| peak_50 | 97.3 | done |