Text set in serif type with a dotted bar in the margin was drafted by an LLM (claude-opus-4-8) and sometimes reviewed by the author. The rest is the author's own. How to read this site
refine_v1
20260713_164535_refine_v1 · complete · published 2026-07-16 · seed 42
Intent
This experiment asks whether the discrete burst structure of the winning schedule from Phase 1 of the φ-landscape study is load-bearing for the two things still open, which are how fast the model reaches a near-peak band (time-to-band) and how few seeds fail (consistency), and whether refining the schedule's staircase toward a smooth curve preserves or improves them.
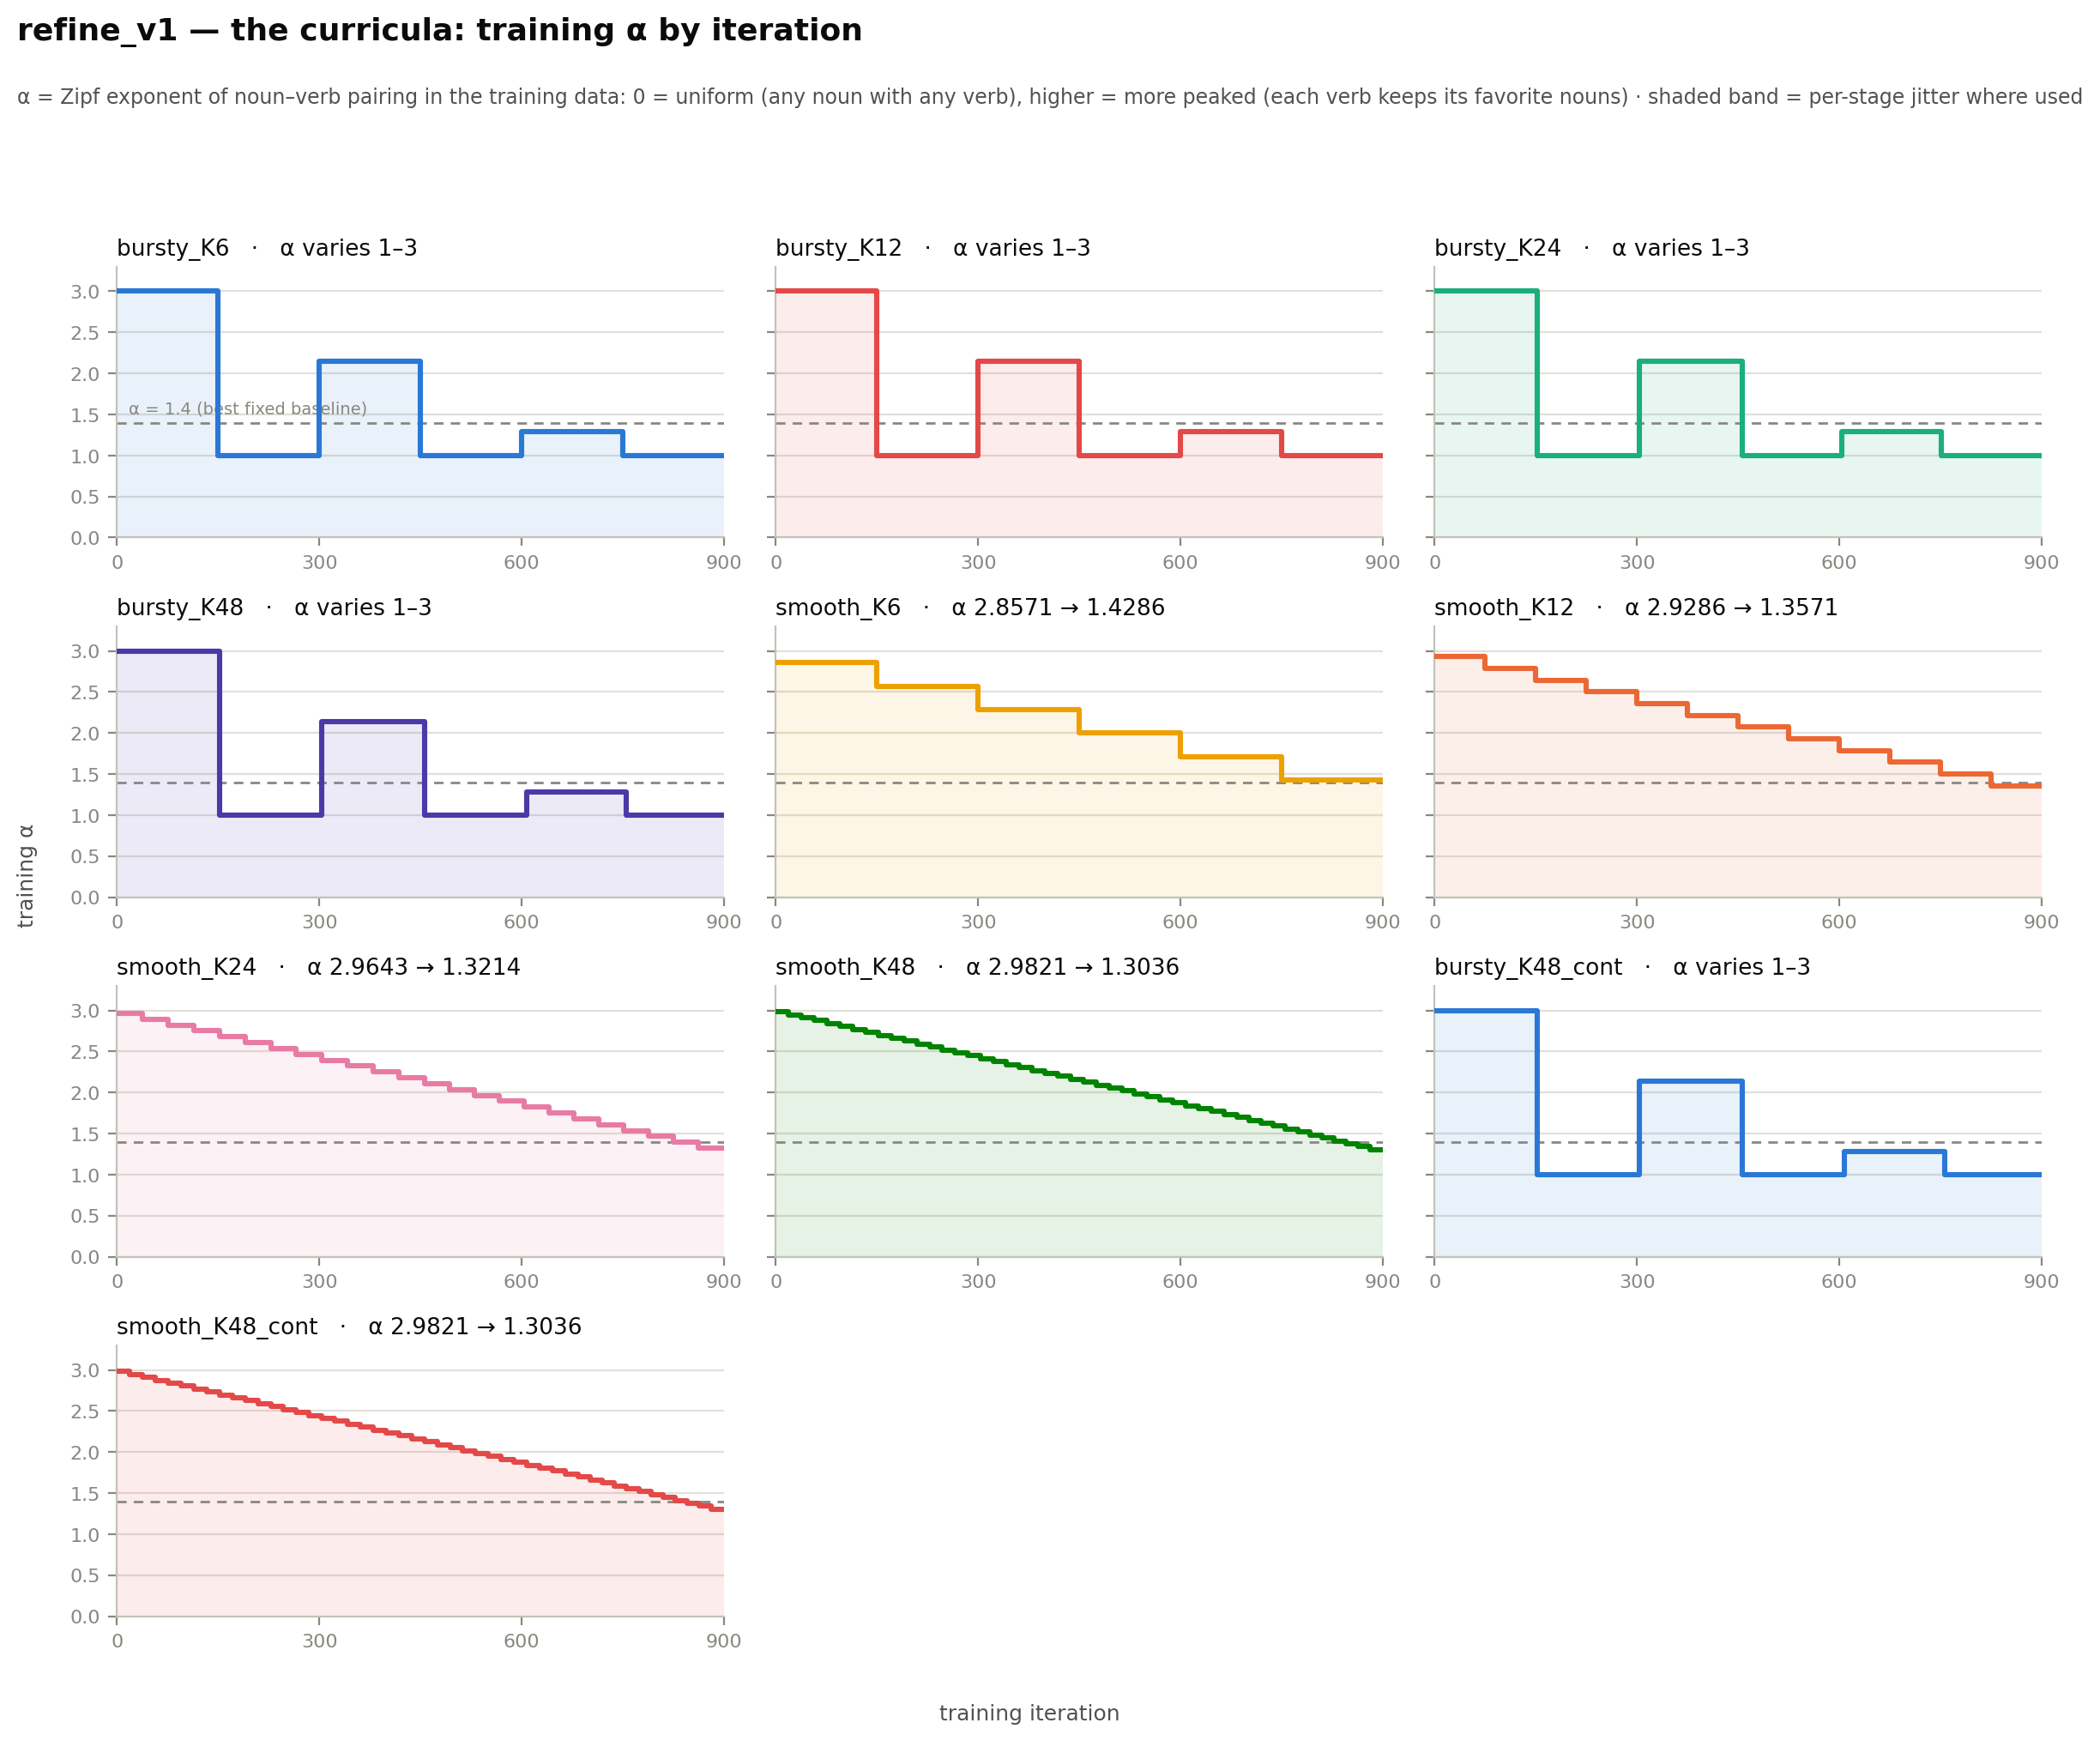
Two shapes, a three-tooth burst ladder like the incumbent and the same descending envelope with the bursts removed, are each realized at increasing staircase fineness K, in the staged setting (fresh finite data per stage) and the continuous setting (every batch sampled fresh).
Background
This is Phase 2 of the φ-landscape study, whose design and full term definitions live in the design spec. It walks the "staircase-to-smooth" refinement axis, reweighted by what Phase 1 settled.
Phase 1 found that the absolute peak of the generalization score is saturated: every arm reaches about 100 per seed, so this phase does not chase height. Phase 1 left two facts to build on: peak height is saturated, and the continuous setting was tighter and faster than staged at the coarse K = 6.
Hypothesis
The predictions are that (1) time-to-band and the failed-seed fraction are governed by the smooth descending envelope rather than by the discrete bursts, so removing the bursts costs little or nothing on speed and consistency; (2) refining K from 6 to 48 leaves time-to-band roughly unchanged for a fixed shape, because the coarse staircase already captures the schedule; and (3) the continuous smooth limit, smooth_K48_cont, is among the fastest and most consistent arms.
Because time-to-band is averaged only over the seeds that reached the band, every timing comparison has to be read together with each arm's fraction of seeds peaking at least 95; a fast time over few survivors is not a win.
Setup
| arm | data regime | datasets | iters/dataset | epochs/dataset |
|---|---|---|---|---|
| bursty_K12 | fresh-dataset-per-stage | 12 | 75 | 0.25 |
| bursty_K24 | fresh-dataset-per-stage | 24 | [37, 38] | [0.12, 0.13] |
| bursty_K48 | fresh-dataset-per-stage | 48 | [18, 19] | [0.06, 0.06] |
| bursty_K48_cont | with-replacement (legacy stream) | ∞ | — | 0.0 |
| bursty_K6 | fresh-dataset-per-stage | 6 | 150 | 0.5 |
| smooth_K12 | fresh-dataset-per-stage | 12 | 75 | 0.25 |
| smooth_K24 | fresh-dataset-per-stage | 24 | [37, 38] | [0.12, 0.13] |
| smooth_K48 | fresh-dataset-per-stage | 48 | [18, 19] | [0.06, 0.06] |
| smooth_K48_cont | with-replacement (legacy stream) | ∞ | — | 0.0 |
| smooth_K6 | fresh-dataset-per-stage | 6 | 150 | 0.5 |
Replicate this experiment
Get the code at this exact version:
git clone https://github.com/ClaireHobbs/imagining-syntax
cd imagining-syntax
git checkout 8926ba5992f7
pip install -e ".[dev]"
Download the config (experiment.yaml) and run:
imsyn exp run experiment.yamlChecks
PASS children_complete PASS replicate_coverage PASS schedule_total_matches_final_waypoint PASS instrument_consistent
Claims
| claim | source | expectation | Δ | seeds | verdict |
|---|---|---|---|---|---|
| smooth_cont_at_least_as_fast_as_bursty_cont | manifest | smooth_K48_cont <= bursty_K48_cont on unseen_mismatch @ final | +441.2 | 2/9 | mixed mean says rejected, seeds 2/9
referenced by
No smooth limit recovers what the bursts do
|
| refinement_leaves_speed_stable | manifest | bursty_K48 ~= bursty_K6 (±75) on unseen_mismatch @ final | -35.7 | 14/20 | mixed mean says held, seeds 14/20 |
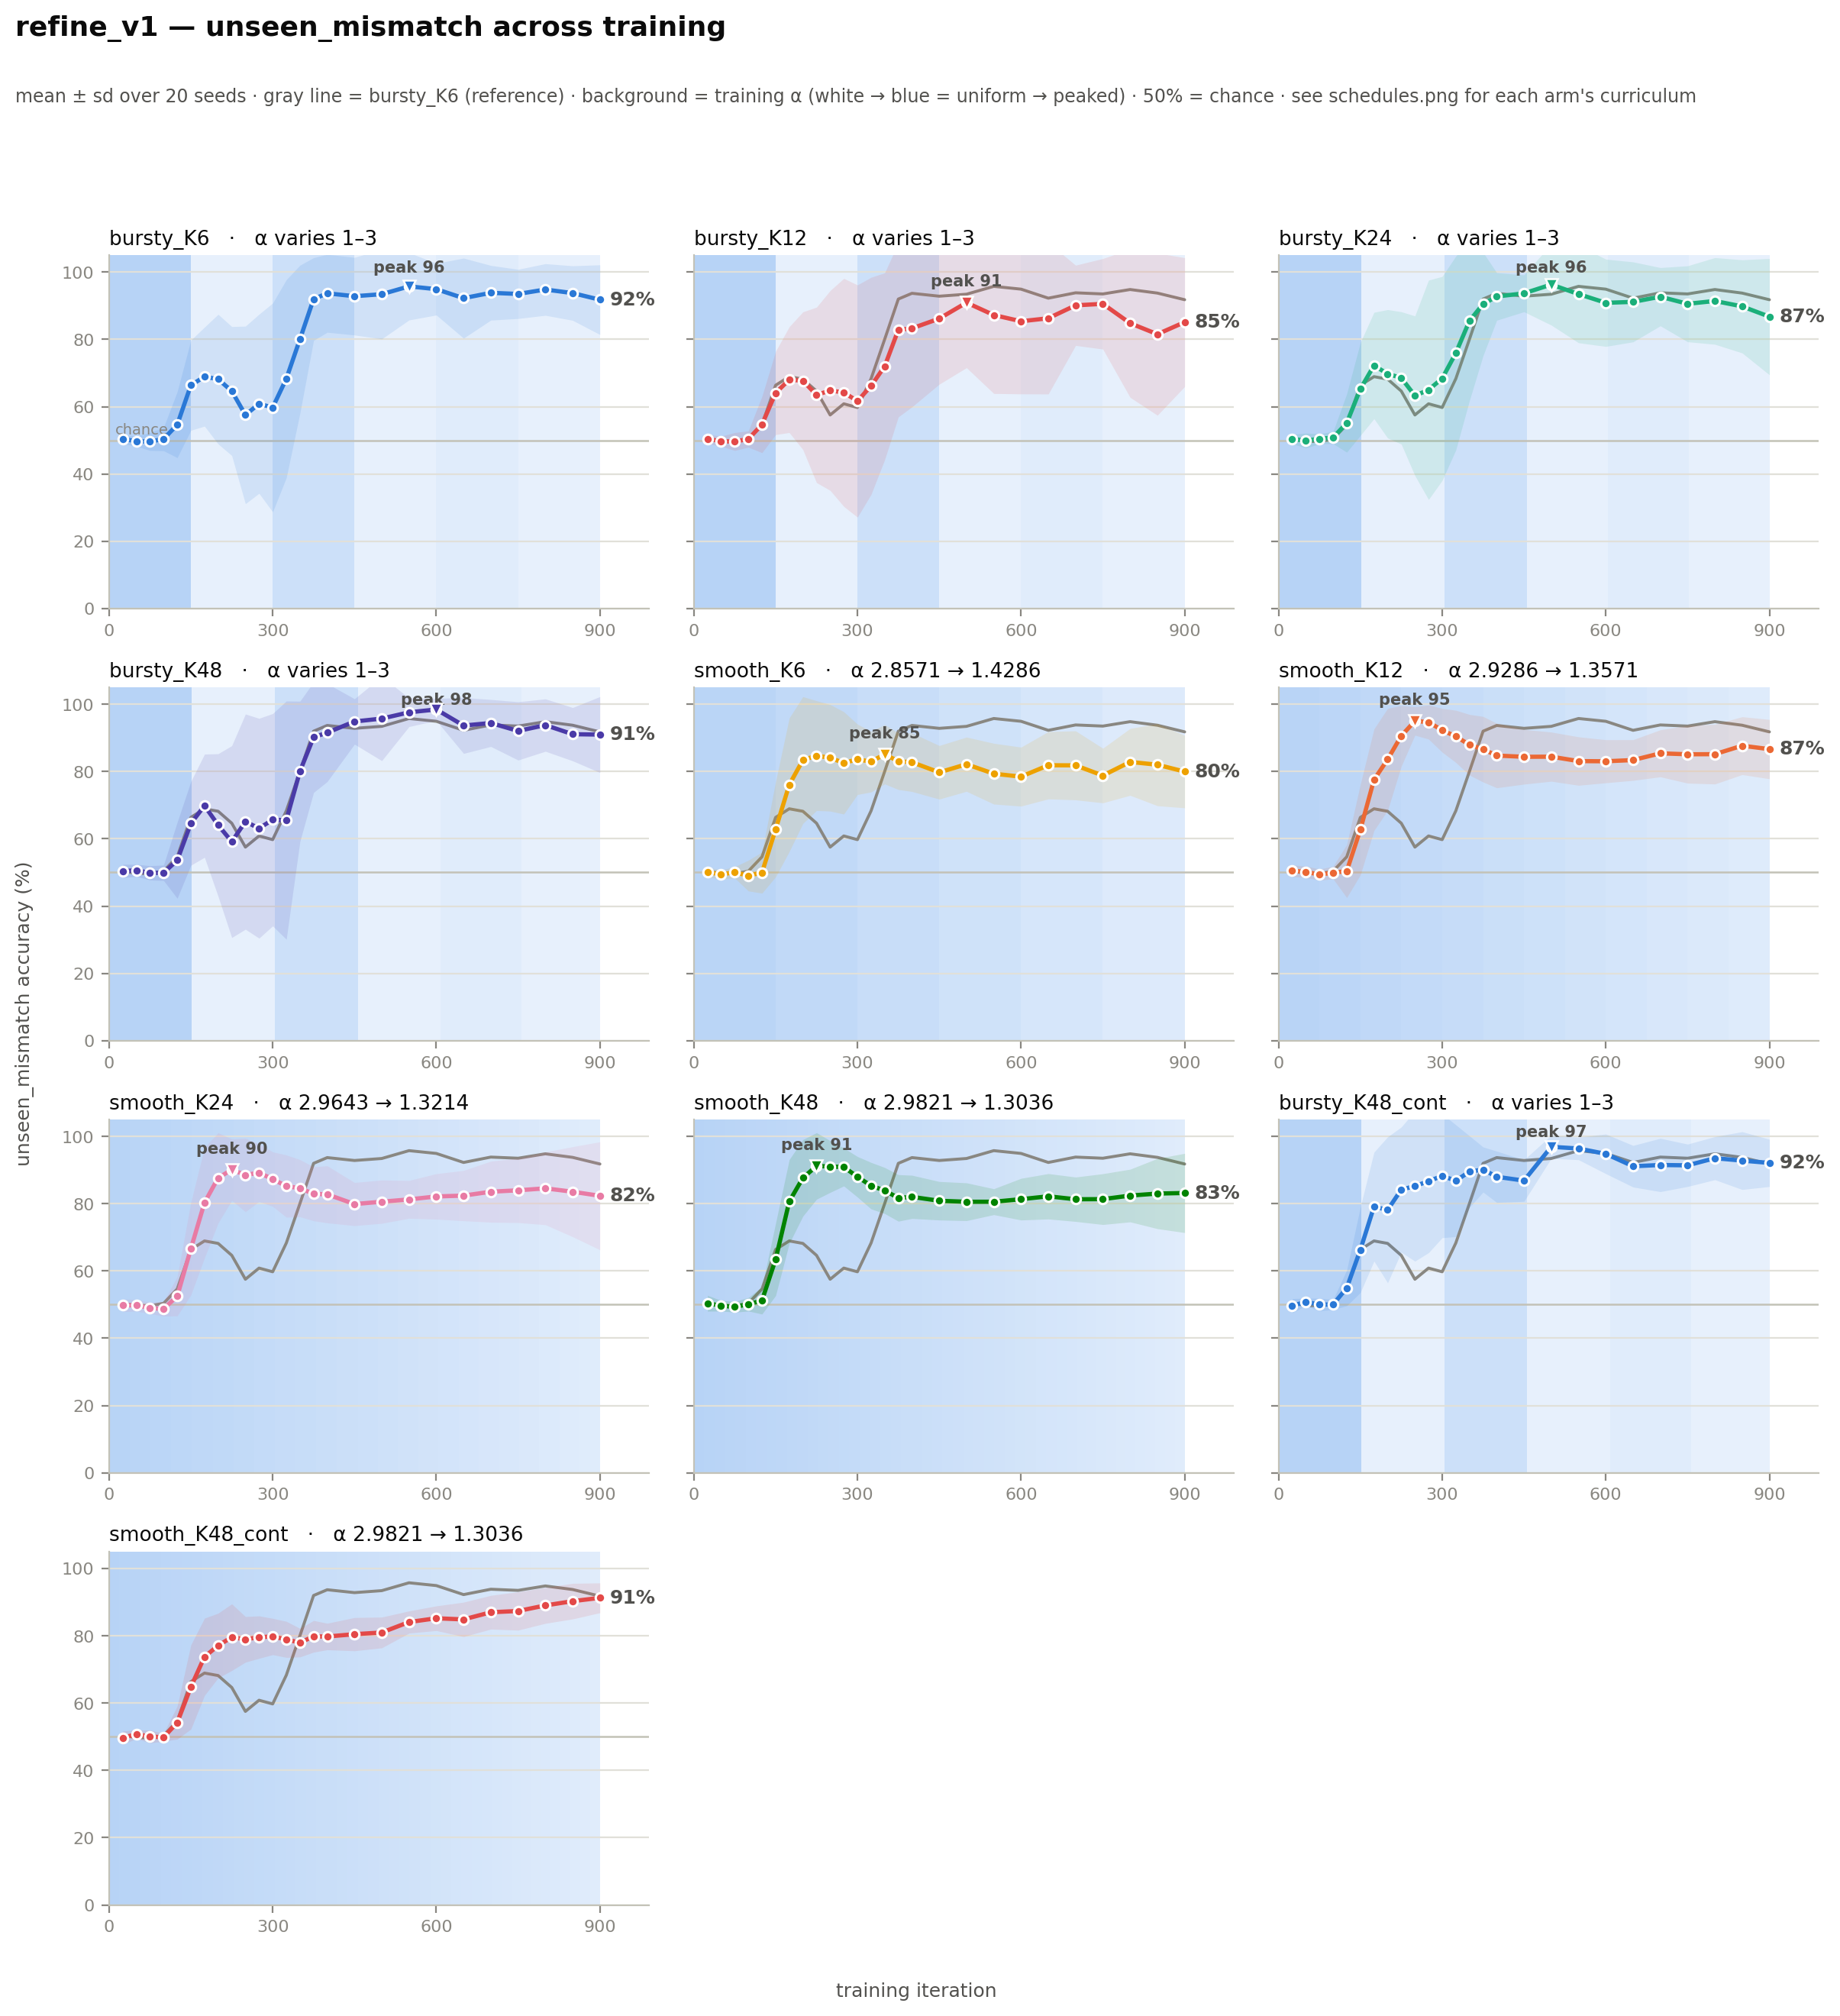
Results — unseen_mismatch (mean ± sd over 20 seeds)
Evaluation data: seen_* probed at reference α = 1.4 · unseen_* = held-out pairings, uniform (α-independent) · 1000 pairs per condition
- Each probe is a minimal pair: a grammatical sentence and its verb-number-flipped twin. The model scores correct when it assigns the grammatical version higher probability; accuracy = % correct over 1000 pairs per condition.
- seen_match / seen_mismatch — noun–verb pairings that occur in training, sampled at fixed reference α = 1.4 (not at the schedule's own α, so arms stay comparable)
- @α conditions (e.g. seen_match@0) — the same seen probes regenerated at reference α = 0, 0.7, 2.1, 3
- unseen_match / unseen_mismatch — held-out noun–verb pairings that never occur in training, sampled uniformly (α = 0), so their difficulty is identical across all arms and training αs
- match vs mismatch — whether the prepositional objects agree in number with the subject; mismatch places attractor nouns between subject and verb (the AGREE-RECENT trap)
| arm | end of training (t = 900) | per-seed | flags |
|---|---|---|---|
| bursty_K12 | 85.1 ±19.2 | ⚠ seed_split: range 38.6-100.0 (2 low / 13 high of 20) | |
| bursty_K24 | 86.8 ±17.3 | ⚠ seed_split: range 39.7-100.0 (2 low / 11 high of 20) | |
| bursty_K48 | 91.0 ±11.3 | ⚠ seed_split: range 49.4-100.0 (1 low / 16 high of 20) | |
| bursty_K48_cont | 92.1 ±7.0 | ||
| bursty_K6 | 91.8 ±10.4 | ⚠ seed_split: range 54.8-100.0 (1 low / 14 high of 20) | |
| smooth_K12 | 86.7 ±8.8 | ||
| smooth_K24 | 82.3 ±16.1 | ⚠ seed_split: range 31.8-97.0 (1 low / 9 high of 20) | |
| smooth_K48 | 83.2 ±11.8 | ⚠ seed_split: range 46.7-97.2 (1 low / 9 high of 20) | |
| smooth_K48_cont | 91.3 ±4.4 | ||
| smooth_K6 | 80.0 ±10.8 | ⚠ seed_split: range 53.0-93.9 (1 low / 10 high of 20) |
Conclusions
The prediction that the bursts could be removed cheaply does not hold. What the bursts govern is not the height a successful seed reaches but how many seeds reach it. The seeds that arrive at the near-peak band get close to 100 under either shape, so the peak stays saturated; what changes when the bursts come out is the number of seeds that arrive at all. On unseen_mismatch, the bursts set coverage.
Concretely, the burst schedules bring 19 or 20 of their 20 replicates to the 95 band, while the staged smooth descending envelopes bring only 12 to 18 of 20, and the smooth continuous limit just 9 of 20. That is the seed coverage gap, and it is a different quantity from the report's replicate-coverage check, which only confirms that every arm ran the same 20 seeds. The effect is confined to generalization: on trained pairings the models agree well everywhere, with seen_mismatch finishing between 91.9 and 99.1 across the ten arms, so the shape changes only whether agreement carries over to pairings the model never saw.
Referenced by (2 direct, 1 transitive)
Direct references:
Transitive (depth 1):
Removing the bursts does make the surviving seeds a little faster. Averaged over the seeds that reached the band, the staged smooth arms cross the 95 line around 212 to 270 iterations, against 312 to 348 for the staged burst ladders. What the smooth shape gives up is the rest of the cohort. Its per-seed peaks scatter (per-seed-peak standard deviation 2.2 to 5.7, per-seed peak means 93.6 to 98.2), so many seeds settle below 95, whereas the burst ladders' seeds land tightly at the ceiling (per-seed-peak standard deviation 0.2 to 0.6 for the clean staged ladders, per-seed peak means 99.8 to 99.9). The drop-to-1.0-and-recover bursts appear to pull the lagging seeds up and bring the cohort in together.
Refining the staircase does little within a fixed shape. The bursty ladders at K = 6, 24, and 48 stages are hard to tell apart: each keeps 20 of 20 coverage and its reached seeds cross the band at mean 347.5, 311.6, and 311.8 iterations. The pre-registered claim refinement_leaves_speed_stable, which expected bursty_K48 to match bursty_K6 within ±75 iterations, is mixed: the mean difference of −35.7 iterations (311.8 against 347.5) sits inside the tolerance, so the mean holds, and 14 of 20 seeds fall within tolerance individually. bursty_K12 is the one ragged rung of the ladder, where a single failed seed pulls its coverage to 19 of 20 and its end-of-training mean to 85.1 ±19.2; that reads as seed noise rather than an effect of refinement.
There is no smooth limit that recovers what the bursts do.
smooth_K48_cont, the finest smooth staircase in the continuous
data regime, is the least reliable arm in the set: only 9 of 20 seeds
reach the band, and the ones that do cross it slowest of all, at mean 701.1
iterations. The pre-registered claim
smooth_cont_at_least_as_fast_as_bursty_cont, which expected
smooth_K48_cont to reach the band at least as fast as
bursty_K48_cont, is mixed and rejected on the mean: smooth's
reached seeds cross at 701.1 against 259.9 for bursty_K48_cont, a
gap of +441.2 iterations, and only 2 of the 9 seeds that reached the band
under both arms met the bound. Removing the bursts in the infinite-data
setting scatters the cohort rather than tightening it, the reverse of
prediction (3).
Referenced by (2 direct, 1 transitive)
Direct references:
Transitive (depth 1):
The best combination of speed and reliability is the burst ladder run on
continuous data. bursty_K48_cont brings its reached seeds to the
band at mean 259.9 iterations, as quickly as the smooth survivors and
faster than the other burst ladders, while keeping the 19 of 20 coverage
that the fast smooth arms never reach. Continuous data speeds the burst
ladder up without costing reliability, which makes it the front-runner
going into the deformation map.
Referenced by (1 direct)
Direct references:
Both claims came back mixed for the same reason, and it is a lesson about the measurement. A single time-to-band read off the seed-median curve blends onset speed with how synchronized the seeds are: an arm whose seeds peak at scattered times can show no median-curve crossing even when most seeds individually cross 95, which is why the report leaves the per-arm crossing time undefined for the low-coverage smooth arms. The honest reading pairs the per-seed time-to-band with coverage, and that pairing is what the numbers here use.
For Phase 3, the deformation map, this points to three things. Center it on the continuous burst ladder, since that is the best combination of speed and reliability found here. Score arms on per-seed time-to-band together with coverage, not on height and not on the median-curve crossing. And treat the burst parameters, valley depth, tooth count, and duty, as the primary axes to vary, because removing the bursts is now a confirmed way to lose coverage and the open question is how deep, how many, and how wide the bursts need to be.
Comparison figures
Children
| Child | peak unseen_mismatch | Status |
|---|---|---|
| bursty_K6 | 95.8 | done |
| bursty_K12 | 90.9 | done |
| bursty_K24 | 96.3 | done |
| bursty_K48 | 98.5 | done |
| smooth_K6 | 85.1 | done |
| smooth_K12 | 95.0 | done |
| smooth_K24 | 90.1 | done |
| smooth_K48 | 91.2 | done |
| bursty_K48_cont | 96.9 | done |
| smooth_K48_cont | 91.3 | done |