Text set in serif type with a dotted bar in the margin was drafted by an LLM (claude-opus-4-8) and sometimes reviewed by the author. The rest is the author's own. How to read this site
ascent_v1
20260713_210738_ascent_v1 · complete · published 2026-07-16 · seed 42
Intent
This phase, the ascent of the φ-landscape study, combines the uphill directions a prior single-deformation map of the burst ladder identified, a high start, a coverage-safe valley depth at or below 1.0, and a small tooth count of 2 to 4, into candidate shapes and asks whether the combination pushes onset below the roughly 197-iteration single-deformation best while holding full 20 of 20 coverage.
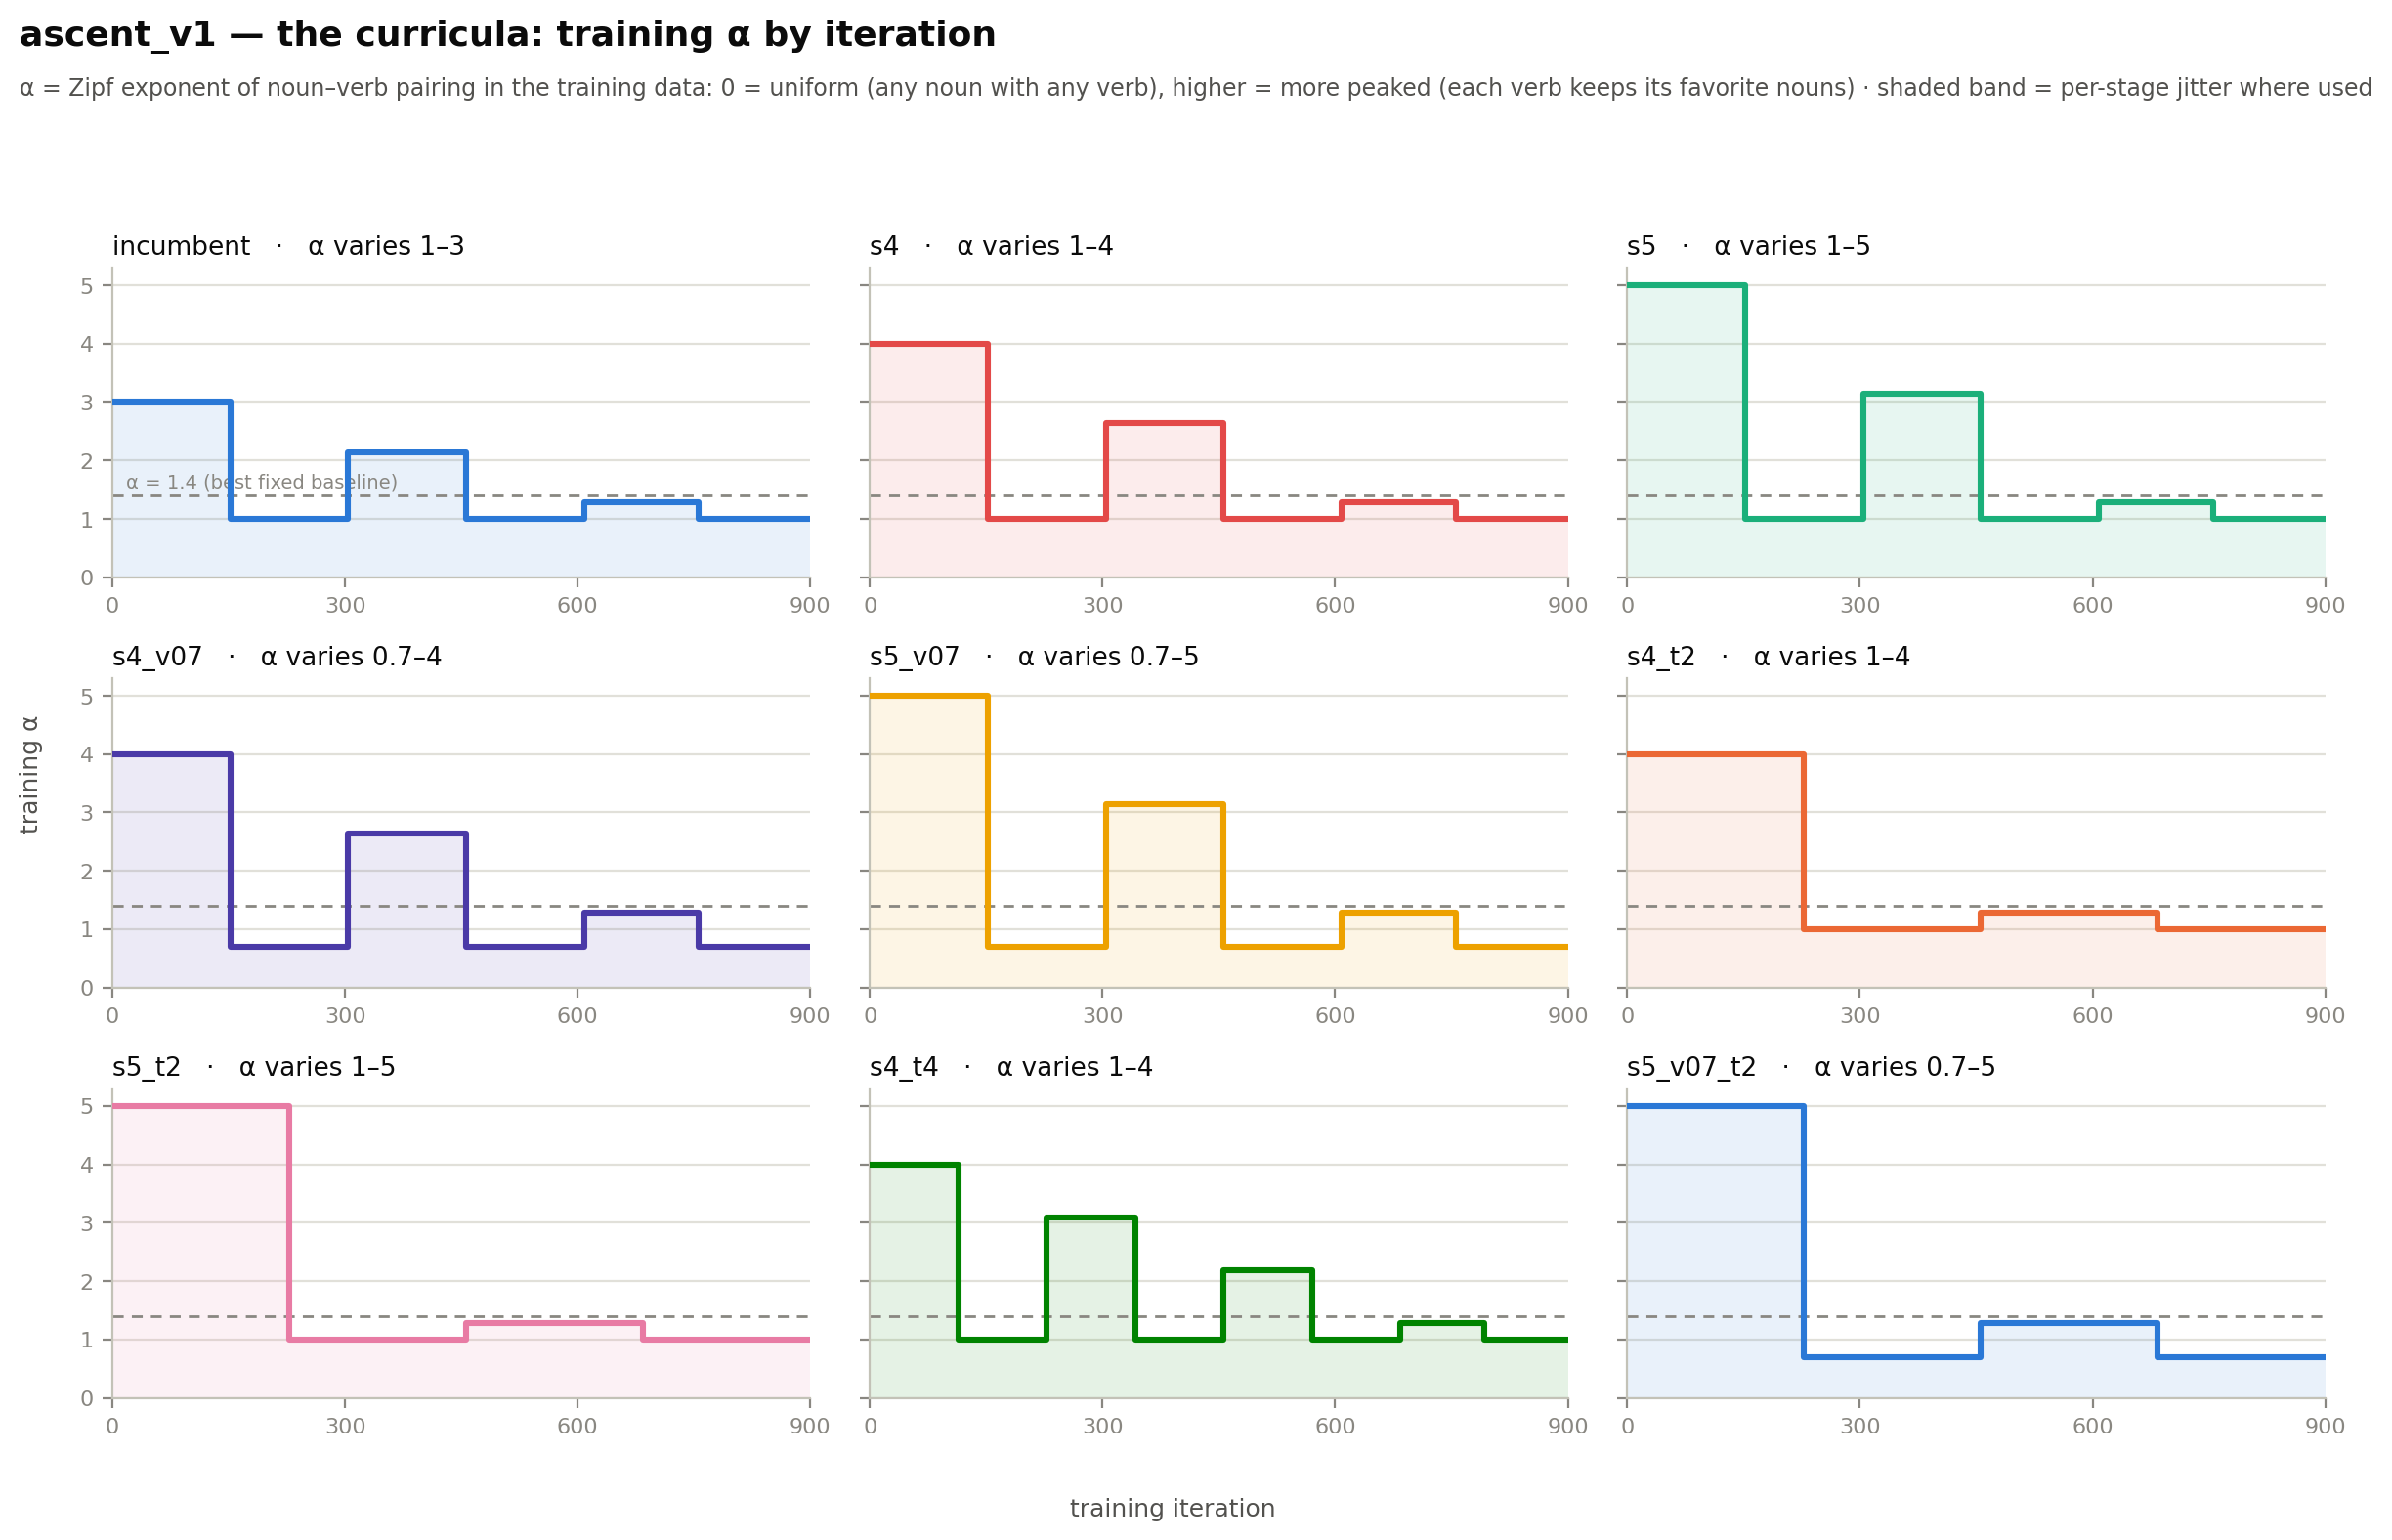
All arms are the continuous burst ladder at
a horizon of 900 iterations, and every arm is scored on a pair of numbers,
the per-seed time-to-band and the coverage (the fraction
of seeds whose peak reaches 95, peak_per_seed.summary.frac_ge[95]),
rather than on the cohort mean. Peak height is saturated near 100 and is
not an objective.
Background
This is Phase 5 of the φ-landscape study, the ascent, whose design and full term definitions live in the design spec. The Phase 3 deformation map found the generalization peak saturation in every direction and located one clear uphill move: raising the burst ladder's envelope start from 3 to 4 or 5 beat the incumbent on both onset speed and coverage.
In the map, start 4 reached the band at about 197 iterations with 20 of 20 coverage and start 5 at about 199 with 20 of 20, against the incumbent's 219 with 19 of 20. A slightly deeper but still coverage-safe valley at 0.7 held 20 of 20 in the map, and fewer teeth, 2, was fast at 248.
Hypothesis
Start looks like the dominant speed lever. Combining a high start of 4 or 5 with a slightly deeper but still coverage-safe valley at 0.7 and fewer teeth, 2, should keep full coverage while shortening onset. The best guess going in is s5_v07_t2. Onset is expected to floor somewhere around 180 to 200 iterations; below that the model cannot bootstrap the rule any faster whatever the schedule, a real speed limit.
Setup
data regime (all arms): with-replacement (legacy stream) — fresh batch every step, no dataset reuse
Replicate this experiment
Get the code at this exact version:
git clone https://github.com/ClaireHobbs/imagining-syntax
cd imagining-syntax
git checkout bceee406c19d
pip install -e ".[dev]"
Download the config (experiment.yaml) and run:
imsyn exp run experiment.yamlChecks
PASS children_complete PASS replicate_coverage PASS schedule_total_matches_final_waypoint PASS instrument_consistent
Results — unseen_mismatch (mean ± sd over 20 seeds)
Evaluation data: seen_* probed at reference α = 1.4 · unseen_* = held-out pairings, uniform (α-independent) · 1000 pairs per condition
- Each probe is a minimal pair: a grammatical sentence and its verb-number-flipped twin. The model scores correct when it assigns the grammatical version higher probability; accuracy = % correct over 1000 pairs per condition.
- seen_match / seen_mismatch — noun–verb pairings that occur in training, sampled at fixed reference α = 1.4 (not at the schedule's own α, so arms stay comparable)
- @α conditions (e.g. seen_match@0) — the same seen probes regenerated at reference α = 0, 0.7, 2.1, 3
- unseen_match / unseen_mismatch — held-out noun–verb pairings that never occur in training, sampled uniformly (α = 0), so their difficulty is identical across all arms and training αs
- match vs mismatch — whether the prepositional objects agree in number with the subject; mismatch places attractor nouns between subject and verb (the AGREE-RECENT trap)
| arm | end of training (t = 900) | per-seed | flags |
|---|---|---|---|
| incumbent | 92.1 ±7.0 | ||
| s4 | 89.8 ±6.5 | ||
| s4_t2 | 86.3 ±9.6 | ||
| s4_t4 | 91.0 ±8.0 | ||
| s4_v07 | 87.5 ±10.0 | ||
| s5 | 91.1 ±5.9 | ||
| s5_t2 | 90.9 ±5.7 | ||
| s5_v07 | 89.8 ±10.6 | ⚠ seed_split: range 56.6-100.0 (1 low / 12 high of 20) | |
| s5_v07_t2 | 85.5 ±11.1 | ⚠ seed_split: range 56.4-98.7 (2 low / 8 high of 20) |
Conclusions
The ascent buys a small, real improvement over the incumbent, and it comes from the start lever rather than from the combination the hypothesis favored. The best arm on the scored pair is s5_v07, the shape that raises the burst ladder's envelope start to 5 and deepens its valley to 0.7 while keeping the incumbent's three teeth. On unseen_mismatch it brings all twenty of its replicates to the 95 band at a mean of 198.8 iterations, the fastest in the experiment, and its seeds peak in a dead heat (per-seed peak mean 100.0, standard deviation 0.0), the tightest arm here. Against this run's own incumbent, which reaches the band at 259.9 iterations over nineteen seeds, that is about sixty iterations sooner and it recovers the one seed the incumbent leaves short.
Referenced by (3 direct, 3 transitive)
Direct references:
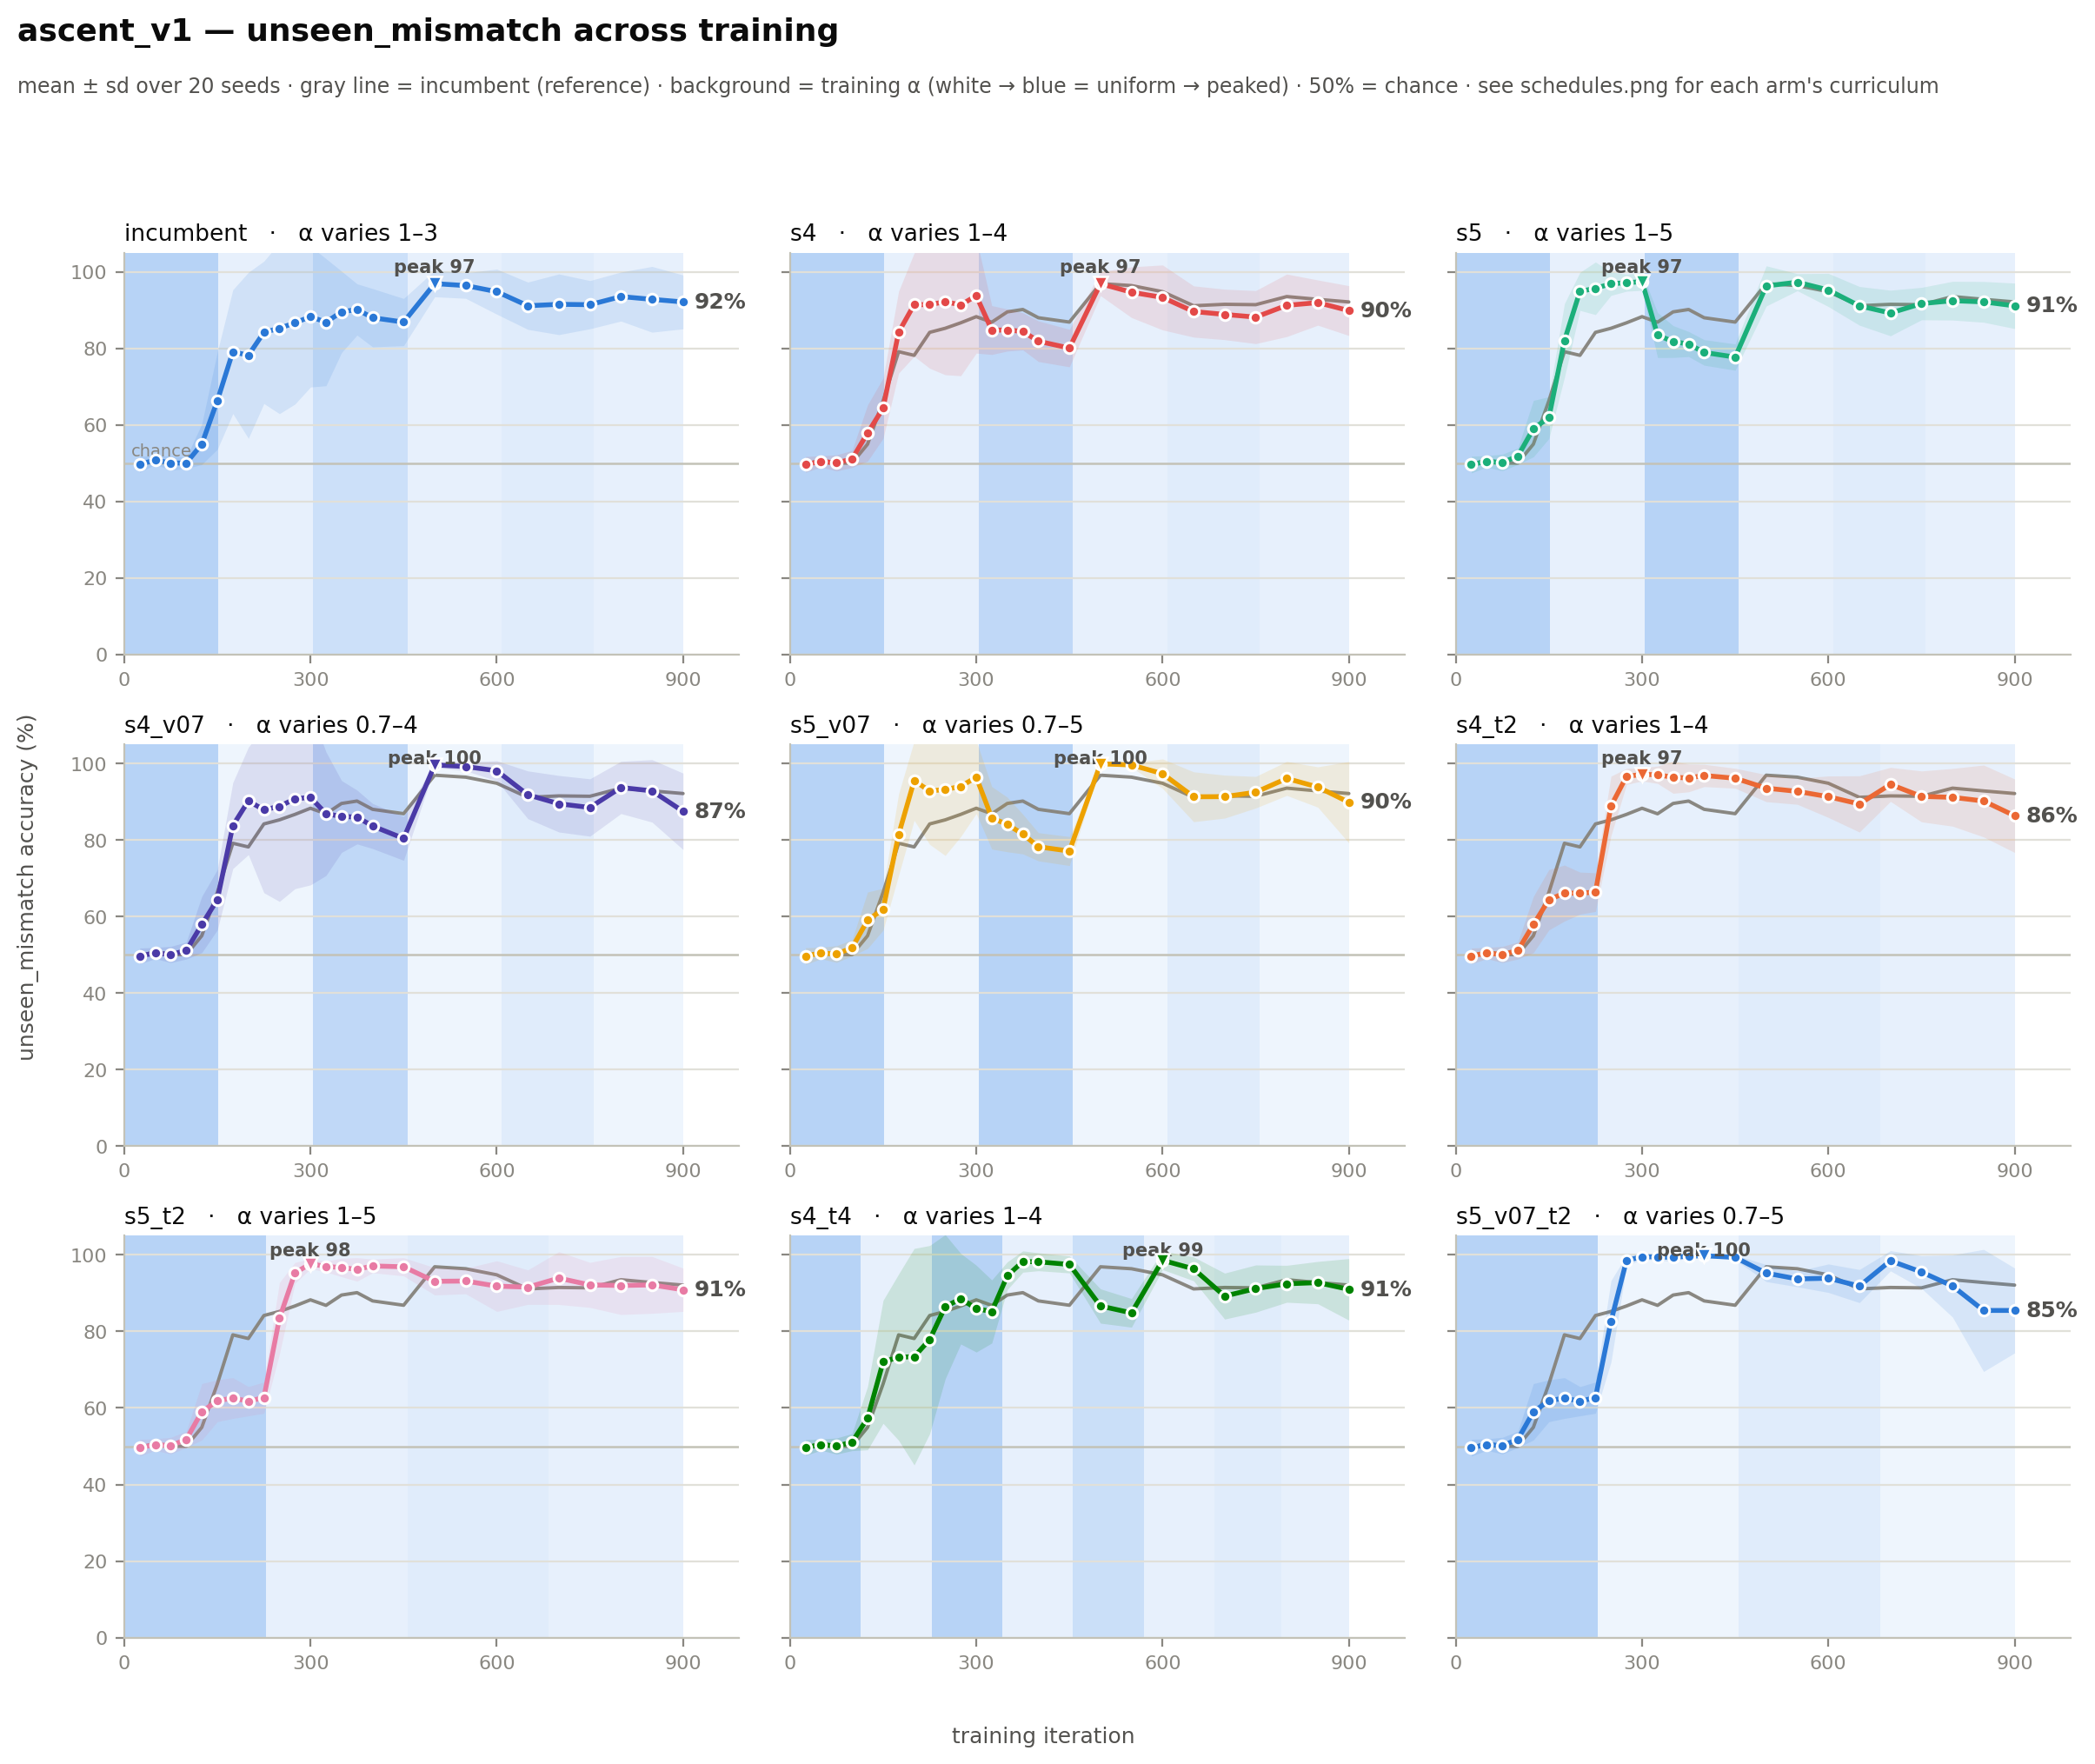
Raising the envelope start is what carries the result. All nine arms are the same burst ladder trained on continuous data, each batch drawn fresh by sampling the current α with replacement, and they differ only in the envelope's start, its valley depth, and its number of teeth. Onset is read per replicate and averaged over the seeds that reached the band, always alongside seed coverage, the fraction of the twenty seeds whose peak crossed 95, since a fast time over few seeds is not a real win. Moving the start from the incumbent's 3 up to 4 (s4, 213.1 iterations) or 5 (s5, 206.4) shortens onset and lifts coverage to a full twenty of twenty, reproducing at matched seeds the uphill direction the map had found. That is the hypothesis's dominant-lever prediction, and the run bears it out.
Coverage turned out to be the easy half of the objective and speed the hard half. Every one of the eight candidate shapes reached twenty of twenty, and only the incumbent left a seed short at nineteen of twenty, so the moves the map suggested all closed the last-laggard gap the incumbent had. (This seed coverage is a different quantity from the report's replicate-coverage check, which confirms only that every arm ran the same twenty seeds.) What separated the arms was how soon their seeds arrived, not whether they arrived.
The hypothesis's other two levers did not survive the run. Dropping to two
teeth was expected to be fast, and the two-tooth combination
s5_v07_t2 was the pre-registered best guess, but the two-tooth
arms were the slowest in the set: s4_t2 at 268.3 iterations,
s5_t2 at 274.3, and s5_v07_t2 at 264.3, all slower
than the incumbent despite their high start and deep valley. Four teeth
(s4_t4, 235.0) sat in between. The fast arms all kept three
teeth, so on this evidence three is the quick setting and the incumbent
was already there; cutting the burst count leaves the lagging seeds
unconsolidated longer rather than sooner. The deeper valley helped only a
little, and only next to the high start: s5_v07 (198.8) edged
out s5 (206.4), while s4_v07 (227.6) was in fact
slightly slower than s4 (213.1). Its clearer effect was to draw
the cohort together at the peak, since the three valley-0.7 arms have the
smallest per-seed peak spread in the experiment.
Onset settles near 199 iterations, and no shape in this set went below it.
The four fastest arms, s5_v07, s5, s4, and
s4_v07, all clear the incumbent at full coverage but span
roughly 199 to 228 iterations, and combining the two uphill directions
(s5_v07) beat raising the start alone (s5) by only
about eight iterations, so near the optimum the directions are close to
non-additive. This floor sits at the top edge of the 180-to-200-iteration
range the hypothesis expected. Whether 199 iterations is a hard
learning-speed limit or a feature of the 900-iteration horizon is not
settled here; the budget frontier, which time-compresses this shape to
shorter horizons, is the test, since onset that keeps shrinking points to
a timing effect and onset that stalls points to a real limit.
Referenced by (2 direct)
Peak height stayed saturation and did not separate the arms, as the intent assumed. Per-seed peak means run from 98.9 to 100.0 across all nine shapes, so every arm reaches the ceiling and the experiment turns on when it gets there and how many seeds make it, not on how high.
One caveat sits outside the scored objective. Post-peak erosion is not
part of this study, but the report flags it, and it is worth naming. By
the 900-iteration horizon every arm has eased off its peak into the
mid-80s to low-90s on unseen_mismatch, and the two start-5, deep-valley
arms trip the seed split flag: s5_v07's final per-seed
values spread from 56.6 to 100.0 and s5_v07_t2's from 56.4 to
98.7, with some seeds down near the chance line.
The shape that wins on onset therefore pays for its speed, and its tight peak, with a more eroded and more divided tail at the horizon. This echoes the near-uniform-tail effect seen across the α-schedule line, but it is not what this experiment measures.
Taken together, the ascent's answer is yes, but only a little. There is a
shape, s5_v07, that reaches the band sooner than the incumbent
and at full coverage, and the gain traces almost entirely to raising the
envelope start; the valley and tooth-count moves either did not help or
hurt, and the predicted best guess landed among the slowest arms. The
speed landscape is nearly flat near its optimum, with a floor around 199
iterations that the budget frontier is set up to probe.
Comparison figures
Children
| Child | peak unseen_mismatch | Status |
|---|---|---|
| incumbent | 96.9 | done |
| s4 | 96.9 | done |
| s5 | 97.4 | done |
| s4_v07 | 99.6 | done |
| s5_v07 | 99.9 | done |
| s4_t2 | 97.1 | done |
| s5_t2 | 97.7 | done |
| s4_t4 | 98.6 | done |
| s5_v07_t2 | 99.8 | done |