Text set in serif type with a dotted bar in the margin was drafted by an LLM (claude-opus-5) and sometimes reviewed by the author. The rest is the author's own. How to read this site
anaphor_n60
20260903_122307_anaphor_n60 · complete · published 2026-09-04 · seed 42
part of investigation anaphor-binding
Intent
This experiment repeats the anaphor sweep with 60 replicates at every α instead of 10, and changes nothing else: the same anaphor task grammar, the same α grid from 0.0 to 3.0 in steps of 0.1, the same 256-wide two-layer four-head model trained for 1200 iterations from seed 42, the same waypoints at 300, 600, 900 and 1200, and a matching oneshot arm at 60 replicates. It is 1,860 models in the Zipfian arm and 60 in the oneshot arm.
The first ten seeds at each α are the ones the earlier run used, because the seed derivation depends only on the α grid and the base seed, both unchanged. That makes the earlier run a strict subset of this one and its ten replicates a free consistency check, and it is also why the pre-registered test below is restricted to the fifty that are new.
The point of the extra replication is one quantity: how often a training run ends up with the binding rule at all. The earlier sweep could not measure that to better than ±0.16, which is wider than any difference worth arguing about. At 60 replicates the standard error is 0.065, and pooling five neighbouring α values brings it to 0.029.
Background
The first anaphor sweep settled one thing and failed to settle another. It settled that accuracy collapses above α of about 2.3 (the plateau and its cliff), and that the collapse is erosion rather than a failure to acquire the rule, since the high-α and plateau seeds are indistinguishable at 300 steps and separate only afterwards. What it could not settle is whether anything happens inside the plateau. The best single α there stood at 8 of 10 against 110 of 220 for the rest, which is p = 0.103, and the mean curve put its maximum at a third α again. Ten replicates cannot tell a real rise of 0.15 from noise; the test had about 0.10 power.
The reason a proportion is the quantity of interest, rather than the mean accuracy the reports lead with, is that the outcome is close to all-or-nothing per seed (two basins, not a spread). A seed finishes either holding the rule or not holding it, so a mean over seeds is a mixture weight wearing the units of an accuracy. Both summaries describe the same measurements and this run reports both.
Hypothesis
The collapse above α of 2.3 should replicate at full strength. Inside the plateau the registered expectation is that there is no interior structure to find, and that the apparent rise near α of 1.0 to 1.2 in the first run was the noise its power predicted.
Three summaries of the same 1,920 measurements are reported, and the analysis is fixed here before the run so that it cannot be chosen afterwards to suit the answer. The first is mean unseen_mismatch at 1200 steps, which is what every other experiment in this corpus reports and is kept for comparability. The second is the proportion of replicates finishing above 90, which is the quantity the two-basin structure makes meaningful; the threshold is 90 and results at 80 and 95 are reported alongside it so the choice can be seen not to matter. The third is a logistic regression of that same above-90 outcome on α across the plateau, with α entering smoothly, tested by likelihood ratio against a flat fit. The regression is the primary test, because it uses every replicate, needs no threshold on α, and asks the question directly: is the plateau flat.
The confirmatory test runs on the fifty replicates that are new at each α. The first ten repeat the seeds that generated the hypothesis being tested, and including them would let the data vouch for itself. All sixty are used for estimation and for the published curve.
If the regression finds no curvature the plateau is flat, α does not influence whether the reflexive finds its subject anywhere below 2.3, and the only thing concentration does to this dependency is destroy it at the top. If it finds curvature, the location and height of the maximum become measurable for the first time, and the comparison against the verb task's peak at 1.2 becomes a real comparison rather than an argument about noise.
Setup
data regime (all arms): single-dataset-recycled — 1 dataset(s) × 1200 iters each = 4.0 epochs per dataset
Replicate this experiment
Get the code at this exact version:
git clone https://github.com/ClaireHobbs/imagining-syntax
cd imagining-syntax
git checkout 836b7a709f88
pip install -e ".[dev]"
Download the config (experiment.yaml) and run:
imsyn exp run experiment.yamlChecks
PASS children_complete PASS replicate_coverage PASS instrument_consistent
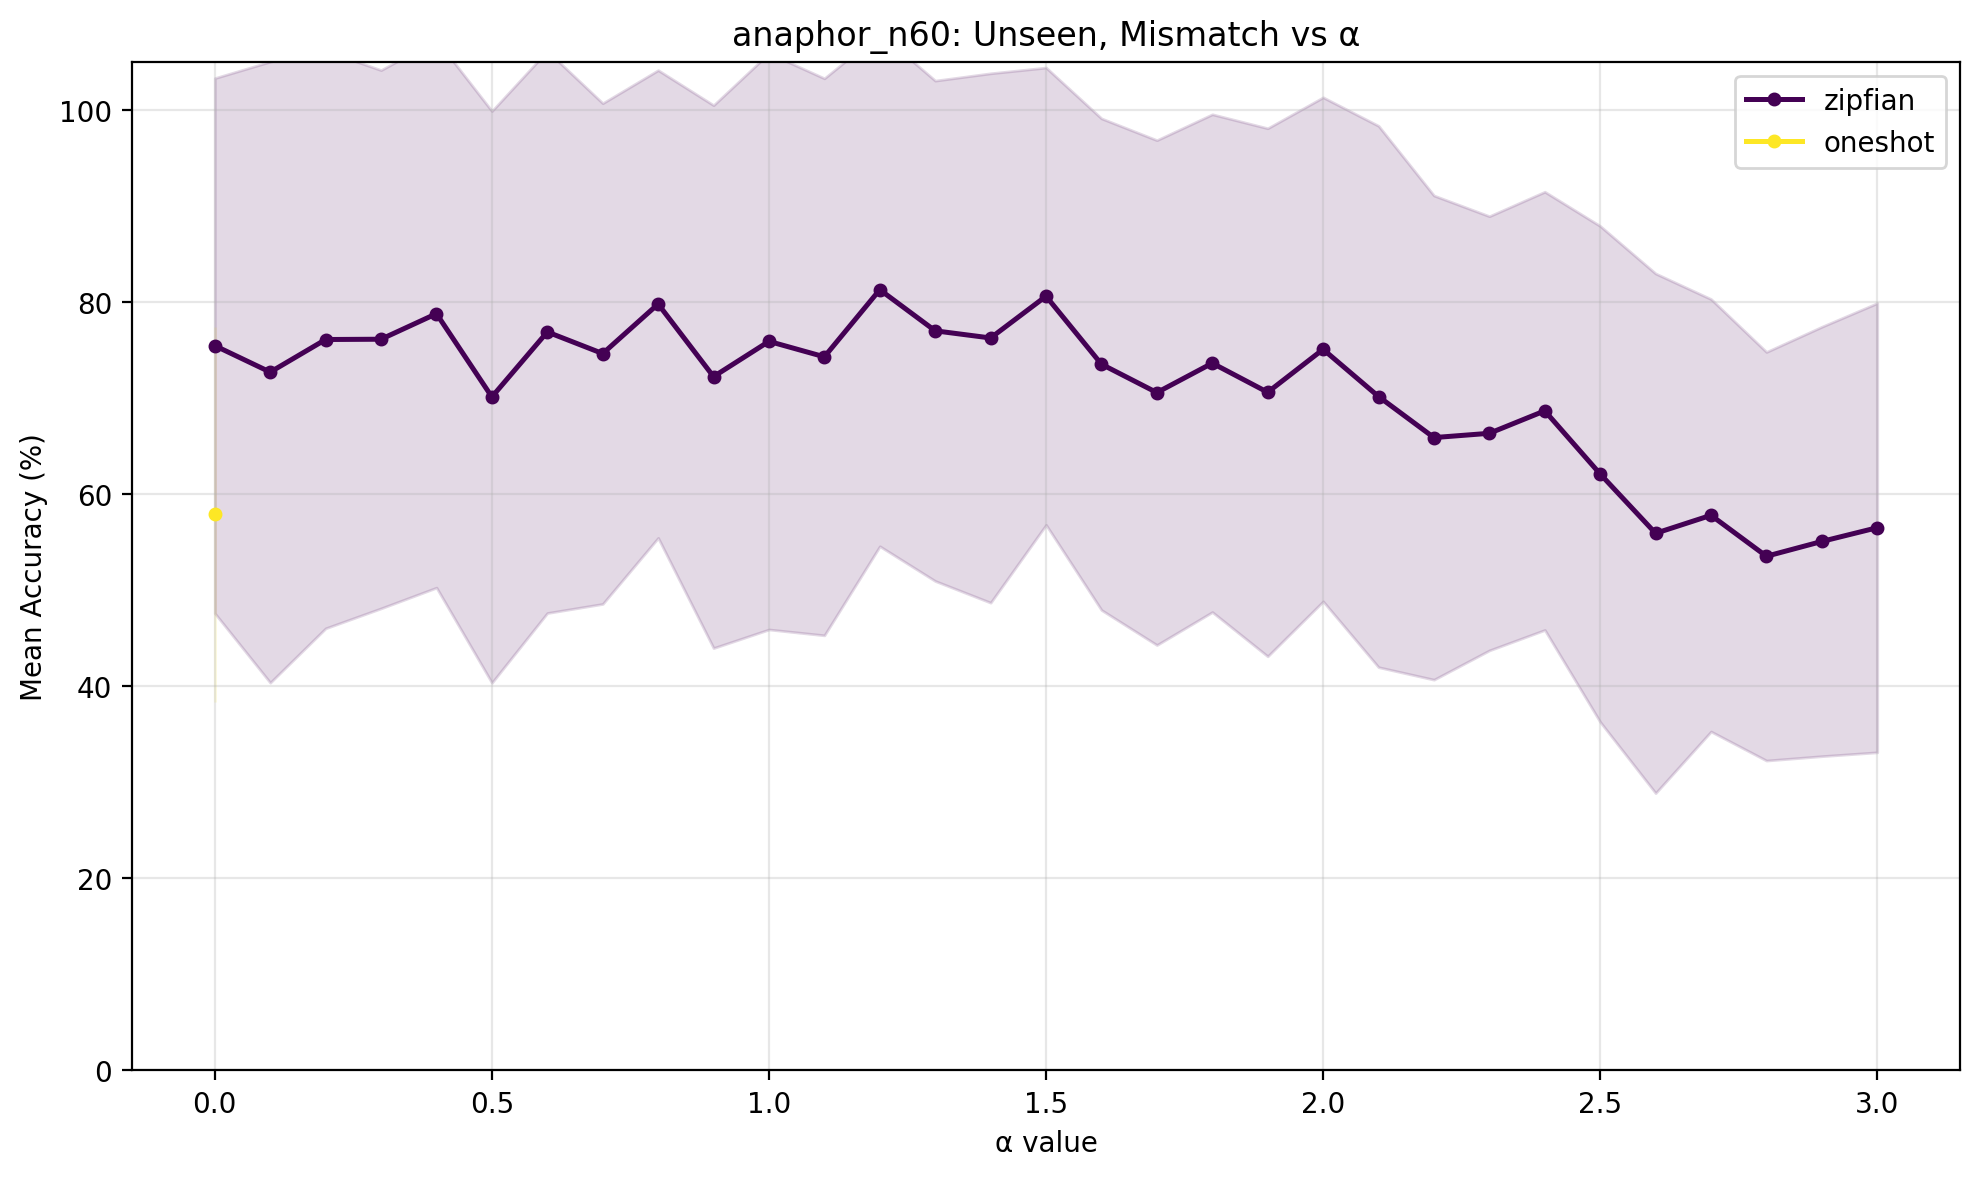
Results — unseen_mismatch (mean ± sd over 60 seeds)
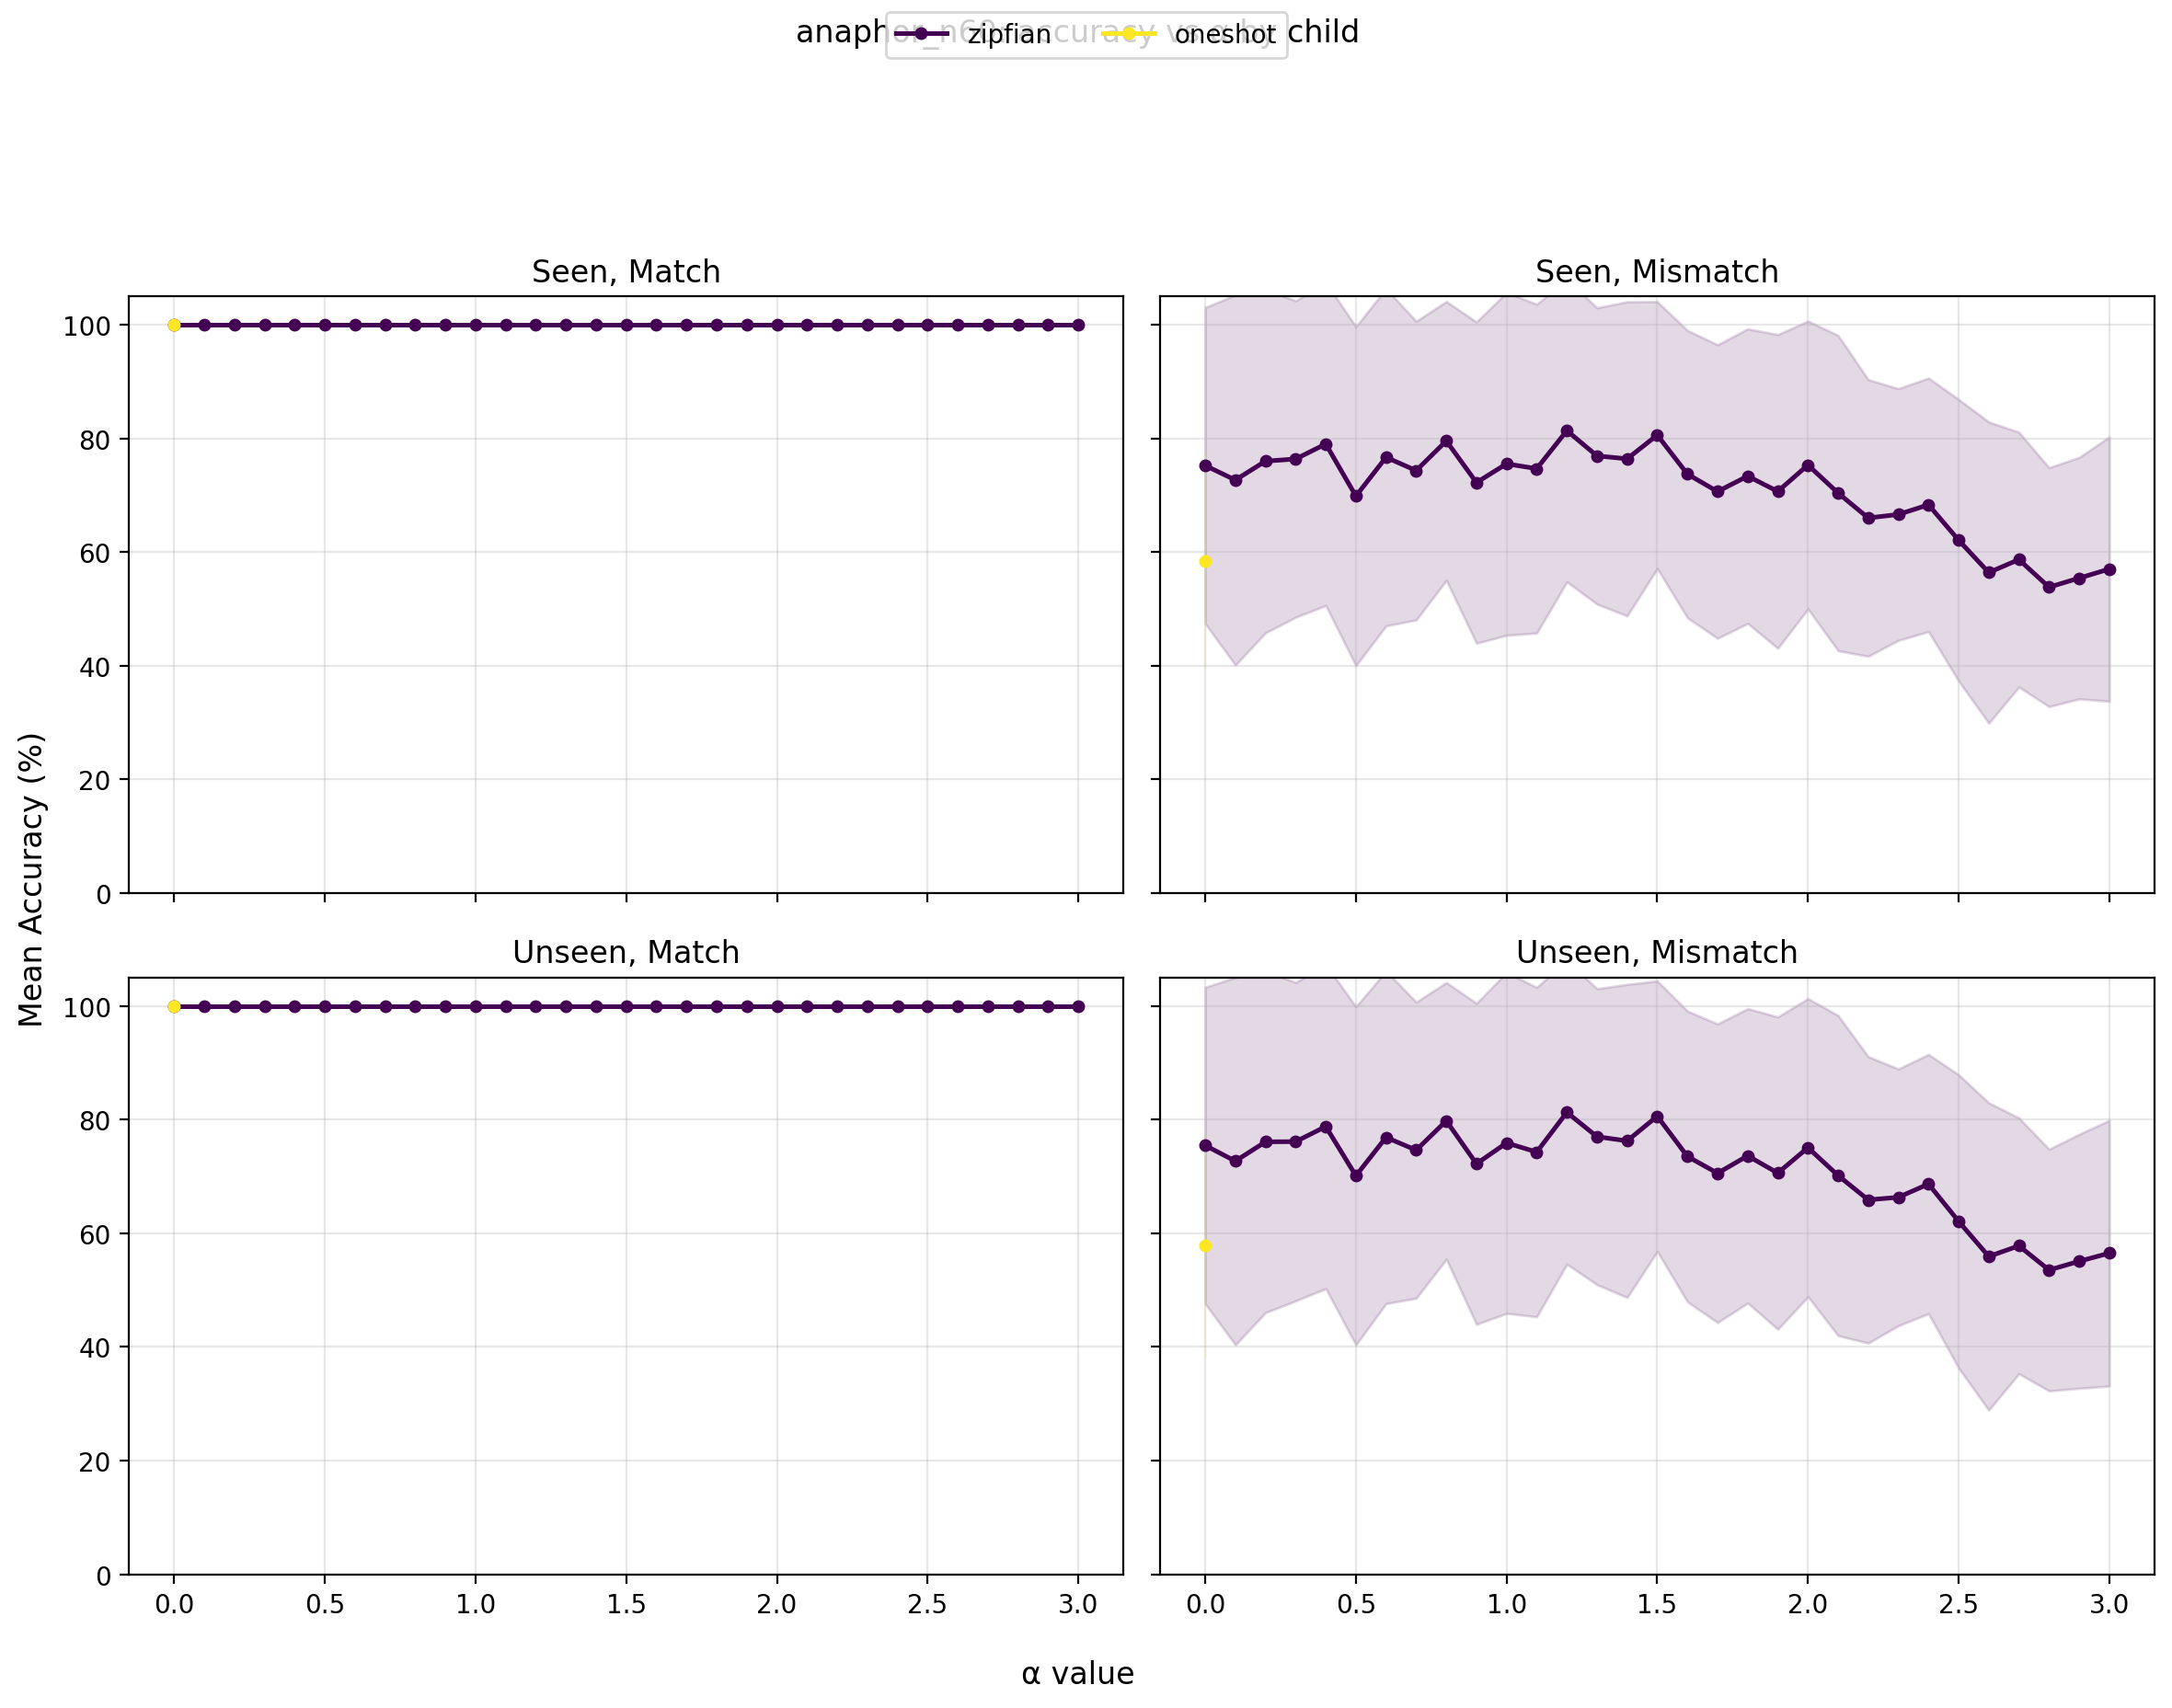
Evaluation data: seen_* generated at each grid point's own training α · unseen_* = held-out pairings, uniform (α-independent) · 1000 pairs per condition
- Each probe is a minimal pair: a grammatical sentence and its reflexive-flipped twin (himself ↔ themselves), the reading that binds an attractor instead of the subject. The model scores correct when it assigns the grammatical version higher probability; accuracy = % correct over 1000 pairs per condition.
- seen_match / seen_mismatch — noun–verb pairings that occur in training, sampled at the same α the model was trained on (matched per grid point, so this eval data varies with the training α)
- unseen_match / unseen_mismatch — held-out noun–verb pairings that never occur in training, sampled uniformly (α = 0), so their difficulty is identical across all arms and training αs
- match vs mismatch — whether the prepositional objects agree in number with the subject; mismatch places attractor nouns between the subject and the clause-final reflexive (the BIND-RECENT trap)
| arm | end of training (t = 1200) | per-seed | flags |
|---|---|---|---|
| oneshot | 57.9 ±19.6 | ⚠ seed_split: range 0.6-97.6 (2 low / 7 high of 60) | |
| zipfian | 81.3 ±26.7 @ α=1.2 | ⚠ seed_split: range 0.0-100.0 (2 low / 37 high of 60) |
Conclusions
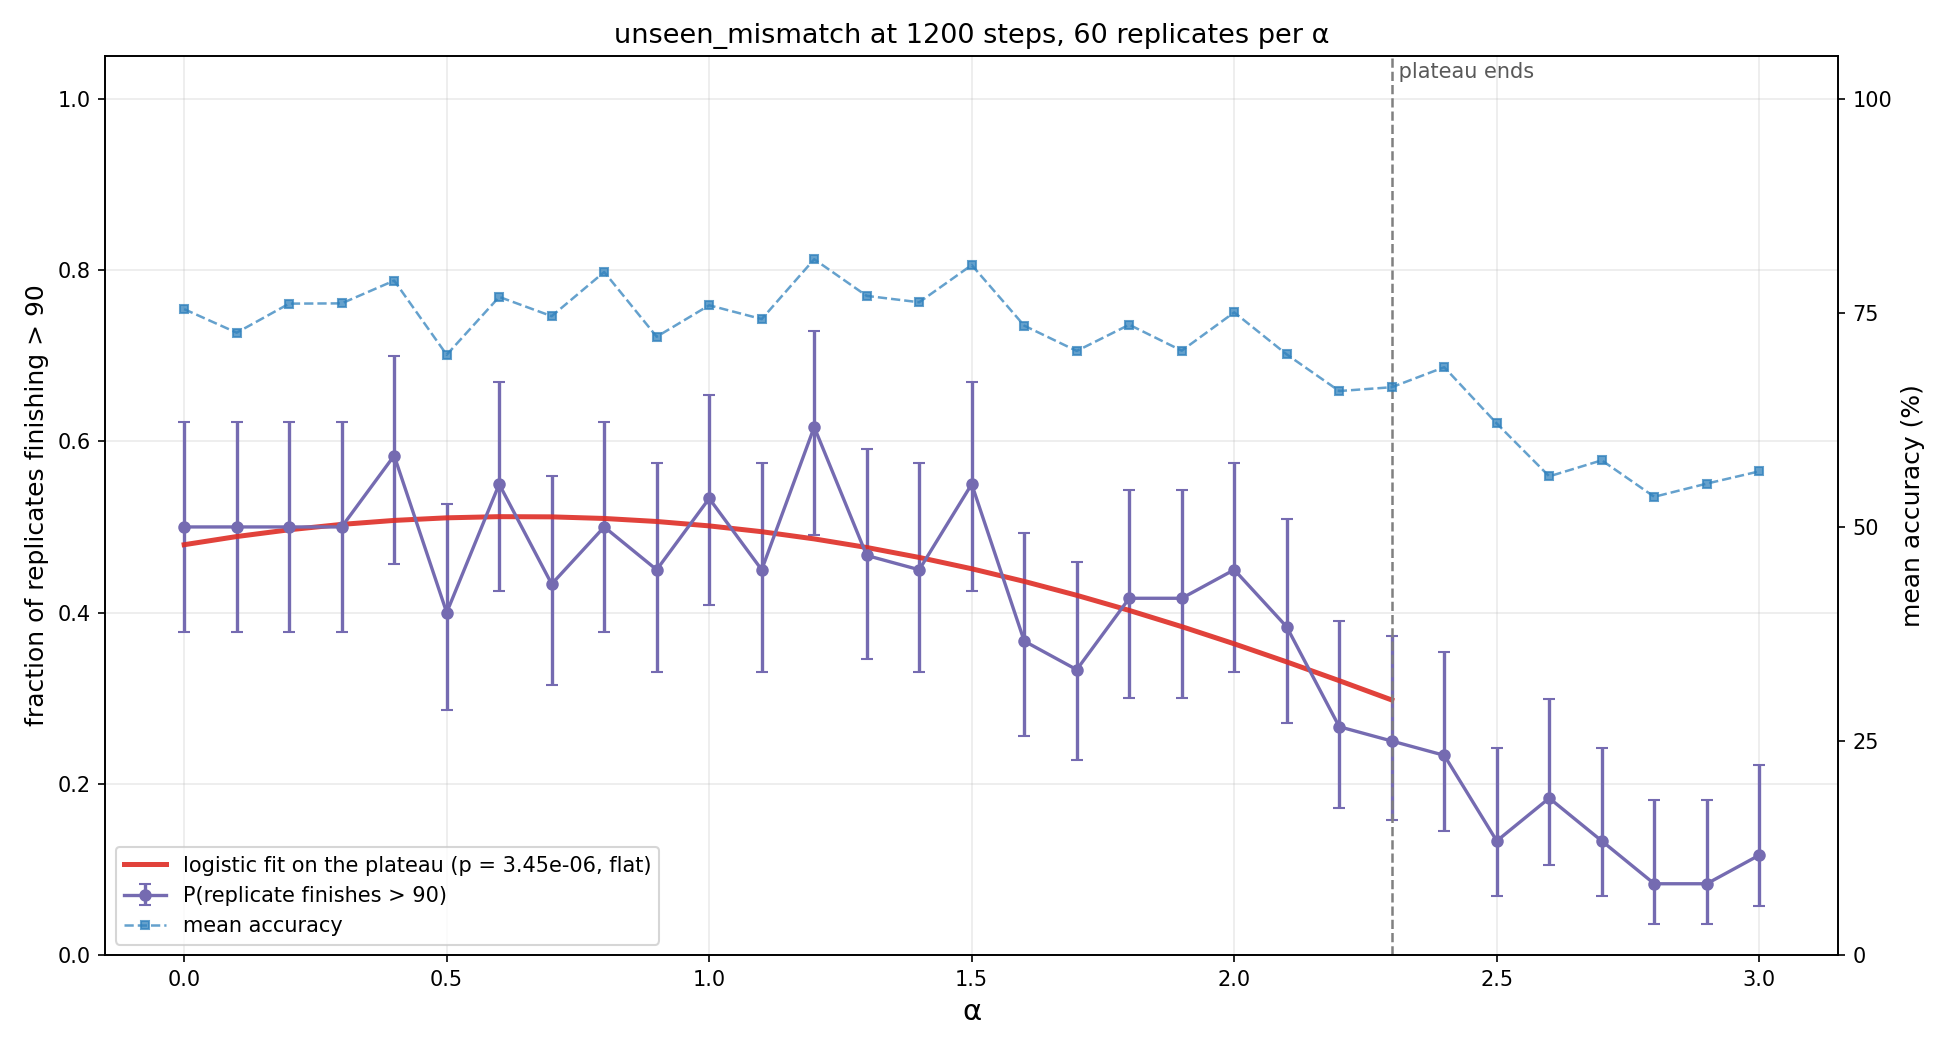
Six times the replication removes the interior optimum rather than resolving it. From α of 0.0 to 1.5 the fraction of replicates that end training holding the reflexive rule is flat at about one half, and from 1.6 upward it falls steadily to about one in ten. There is no peak anywhere in the range. The pre-registered expectation of an interior optimum well above 1.4 is rejected, and so is the weaker reading that 1.0 to 1.2 was elevated.
Fitted on 0.0 to 1.5 alone, the acquisition rate is flat: χ² = 0.25 on two degrees of freedom, p = 0.881, over 960 replicates. Fitted on 1.6 to 3.0 it declines monotonically, p = 2.0 × 10⁻¹⁵. The contrast that the first sweep described as a cliff above 2.3 survives at overwhelming strength, 652 of 1440 against 58 of 420 (p = 8.4 × 10⁻³⁵ at a threshold of 90, and the same separation at 80 and 95), but the boundary was drawn in the wrong place: the fall begins around 1.5 and 2.3 is simply a point partway down it.
Three features of the ten-replicate sweep were noise, and it is worth recording which, because each of them was visible enough to reason about. The dip at uniform was the largest: 2 of 10 there became 30 of 60, an ordinary half. The apparent rise at 1.2 was 8 of 10 and is 37 of 60, which is 0.62 against a plateau average of 0.50 and no longer stands out. And the mean at uniform moved from 53.1 to 75.4, which is the same lesson in the units the rest of the corpus reports.
Mean accuracy, the proportion of replicates above threshold, and the logistic fit of that proportion tell one story on this data. The mean sits between 70 and 81 across the flat region and falls to between 53 and 62 above 2.5; the proportion sits near 0.50 and falls to near 0.10; the fit finds no interior structure in either. The thresholds of 80, 90 and 95 give the same shape, so nothing here depends on where the line between holding the rule and not holding it is drawn. Where the summaries would have disagreed is on the earlier sweep, whose mean put its maximum at 1.6 and whose proportion put it at 1.2, neither of which was real.
Every α on the grid acquires the rule at the same rate. Fitted across the whole range at 300 steps, the acquisition rate is flat: quadratic p = 0.179, linear p = 0.332, over 1,860 replicates. The plateau and the high end are indistinguishable there, 0.48 against 0.49 with Fisher p = 0.853. Structure appears only afterwards, and then quickly: the same contrast is p = 2.5 × 10⁻¹⁵ at 600, p = 7.7 × 10⁻²⁹ at 900 and p = 1.5 × 10⁻³⁹ at 1200.
The retention counts say the same thing from the other side. Most replicates hold the rule at some point regardless of α, including 232 of 360 above α = 2.5, but 56% of those lose it again by the end of training against 26% in the flat region. Concentrating the pairings does not stop a model learning to bind the reflexive. It makes it forget faster.
The analysis registered before the run reported curvature with a maximum at α = 0.64, and that maximum does not exist. A rate that is level and then falls is fitted better by a downward parabola than by a flat line, and the parabola puts its vertex inside the level stretch. The test was answering whether a quadratic beats a constant, which it does, and being read as though it had answered whether there is an optimum, which it had not.
Refitting on shrinking windows is what exposes it. The vertex sits at 0.74 across 0.0 to 3.0, at 0.64 across 0.0 to 2.3, disappears by 0.0 to 2.0, and the range below is flat. A feature that is really in the data does not migrate and then vanish. The tool now requires a fitted vertex to clear the better window edge in the measured counts, not in the fitted curve, before it will call it a maximum; at this vertex the parabola claims a rise of 0.063 where the data has 0.000. Reported here rather than quietly corrected, because the pre-registration is only worth something if the times it misleads are written down beside the times it works.
Read together with the waypoints, the flat stretch and the decline are one phenomenon rather than two. Nothing about α decides whether the rule is learned; α decides how long it survives, and 1200 steps is simply where the survival curves have separated enough to look like a curve over α. Pooled over the grid, acquisition itself peaks at 600 steps at 0.522 and falls to 0.382 by 1200, so the measurement most reports would quote is taken well after the best moment.
What would change this reading. The flat stretch is now measured to about ±0.065 per α and ±0.03 pooled, which is enough to exclude a rise of the size the hypothesis expected but not enough to exclude a very small one; a genuinely flat curve and one bowed by 0.03 look alike here. The decline's starting point is described by fitting windows and eyeballing where significance appears, which is weaker than fitting a changepoint and giving it an interval, and worth doing properly before the number 1.5 is quoted anywhere. Everything is measured at a fixed 1200-step budget, and since the first sweep showed the collapse to be erosion rather than a failure to learn, the location of the decline is a statement about this budget and should be expected to move with it.
Comparison figures
Children
| Child | peak unseen_mismatch | Status |
|---|---|---|
| zipfian | 87.5 | done |
| oneshot | 62.0 | done |